Answered step by step
Verified Expert Solution
Question
1 Approved Answer
Final Project: Problem Statement At this point, you have completed four weeks of intensive training in statistical analysis using the Python programming language. You know
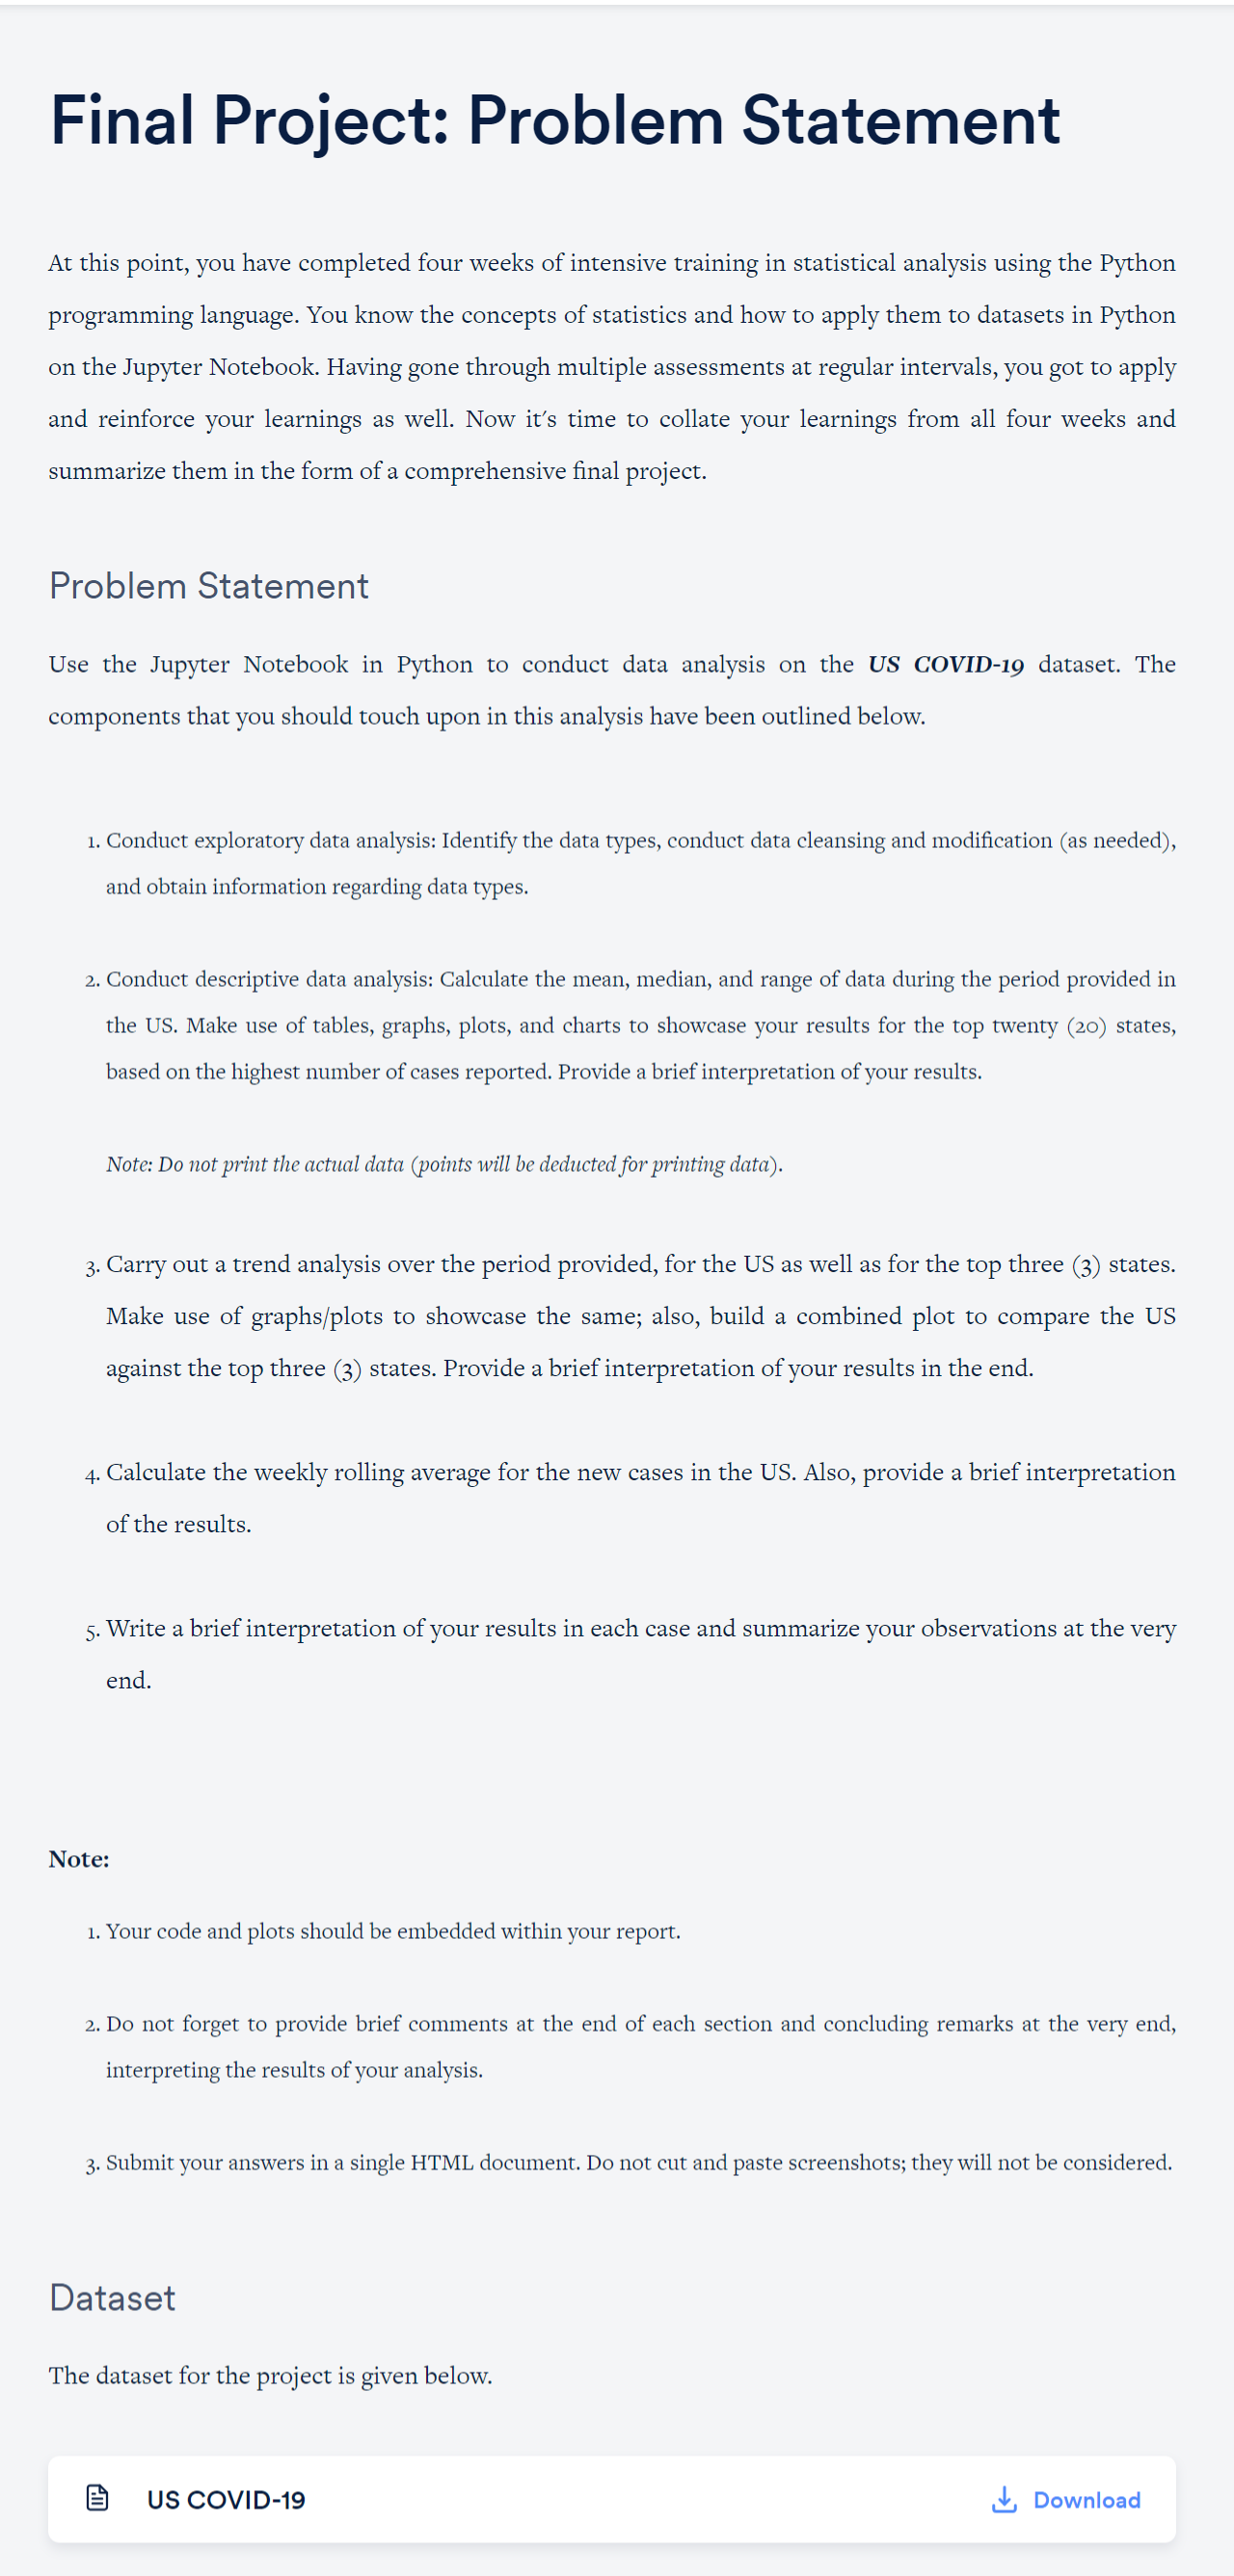
Final Project: Problem Statement
At this point, you have completed four weeks of intensive training in statistical analysis using the Python
programming language. You know the concepts of statistics and how to apply them to datasets in Python
on the Jupyter Notebook. Having gone through multiple assessments at regular intervals, you got to apply
and reinforce your learnings as well. Now it's time to collate your learnings from all four weeks and
summarize them in the form of a comprehensive final project.
Problem Statement
Use the Jupyter Notebook in Python to conduct data analysis on the US COVID dataset. The
components that you should touch upon in this analysis have been outlined below.
Conduct exploratory data analysis: Identify the data types, conduct data cleansing and modification as needed
and obtain information regarding data types.
Conduct descriptive data analysis: Calculate the mean, median, and range of data during the period provided in
the US Make use of tables, graphs, plots, and charts to showcase your results for the top twenty states,
based on the highest number of cases reported. Provide a brief interpretation of your results.
Note: Do not print the actual data points will be deducted for printing data
Carry out a trend analysis over the period provided, for the US as well as for the top three states.
Make use of graphsplots to showcase the same; also, build a combined plot to compare the US
against the top three states. Provide a brief interpretation of your results in the end.
Calculate the weekly rolling average for the new cases in the US Also, provide a brief interpretation
of the results.
Write a brief interpretation of your results in each case and summarize your observations at the very
end.
Note:
Your code and plots should be embedded within your report.
Do not forget to provide brief comments at the end of each section and concluding remarks at the very end,
interpreting the results of your analysis.
Submit your answers in a single HTML document. Do not cut and paste screenshots; they will not be considered.
Dataset
The dataset for the project is given below.

Step by Step Solution
There are 3 Steps involved in it
Step: 1

Get Instant Access to Expert-Tailored Solutions
See step-by-step solutions with expert insights and AI powered tools for academic success
Step: 2

Step: 3

Ace Your Homework with AI
Get the answers you need in no time with our AI-driven, step-by-step assistance
Get Started


