Question
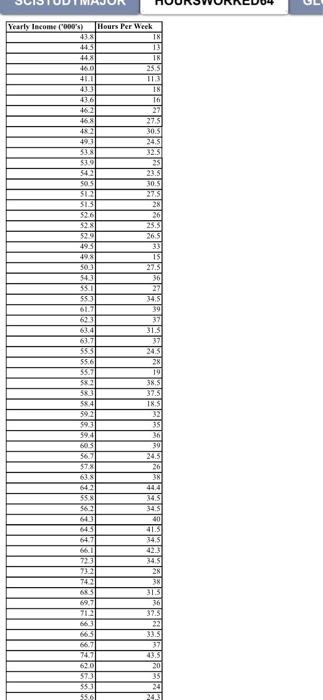
Finally, the researcher considers using regression analysis to establish a linear relationship between the two variables hours worked per week and income earned per
Finally, the researcher considers using regression analysis to establish a linear relationship between the two variables – hours worked per week and income earned per year.
(a) What is the dependent variable and independent variable for this analysis? Why?
(b) Use an appropriate plot to investigate the relationship between the two variables. Display the plot. On the same plot, fit a linear trend line including the equation and the coefficient of determination R2.
(c) Estimate a simple linear regression model and present the estimated linear equation. Display the regression summary table and interpret the intercept and slope coefficient estimates of the linear model.
(d) Display and interpret the value of the coefficient of determination, R-squared (R2).
the data is this one![SUISTUTIVAJON MUUNSVVUNALDUYUL Yearly Income (000s) Hours Per Week 44.5| |||| 41 | 劃司司自 5025| 512 国司 正-- |AI| ( 35 | 59] |](https://dsd5zvtm8ll6.cloudfront.net/si.experts.images/questions/2022/06/62a06f7ee1430_1654681467887.jpg)

Yearly Income ('000's) Hours Per Week 43.8 18 44.5 13 44.8 18 46.0 25.5 41.1 11.3 43.3 18 43.6 16 46.2 27 46.8 27.5 48.2 30.5 49.3 24.5 53.8 32.5 $3.9 25 54.2 50.5 51.2 31.3 52.6 52.8 52.90 495 49.8 50.3 $43 55.1 55.3 61.7 62 63.4 55.5 55.6 55% 58.2 58.3 58.4 59.2 59.3 59.4 60.5 56. $7.8 63.8 642 55.8 56.2 64.3 64.5 72.3 73.2 742 6X 69, 71.2 66.3 66.5 66. 747 62.0 57.3 55.3 55.6 23.5 30.5 27.5 28 26 25.3 26.5 33 15 27.5 36 27 34.5 39 37 31.5 37 24.5 19 38.5 37.5 18.5 32 35 36 39 24.5 26 38 44.4 34.5 34.5 40 41.5 34.5 42.3 34.5 28 38 31.5 36 37.5 33.5 37 43.5 20 35 24 24.3
Step by Step Solution
3.39 Rating (158 Votes )
There are 3 Steps involved in it
Step: 1
aHere income is dependent variable and worked hours ...
Get Instant Access to Expert-Tailored Solutions
See step-by-step solutions with expert insights and AI powered tools for academic success
Step: 2

Step: 3

Ace Your Homework with AI
Get the answers you need in no time with our AI-driven, step-by-step assistance
Get Started


