Answered step by step
Verified Expert Solution
Question
1 Approved Answer
Finance 211 - Assignment #1 Submit your answers using the Assignment #1 Online link in Moodle There are 2 Parts to the Assignment Part A
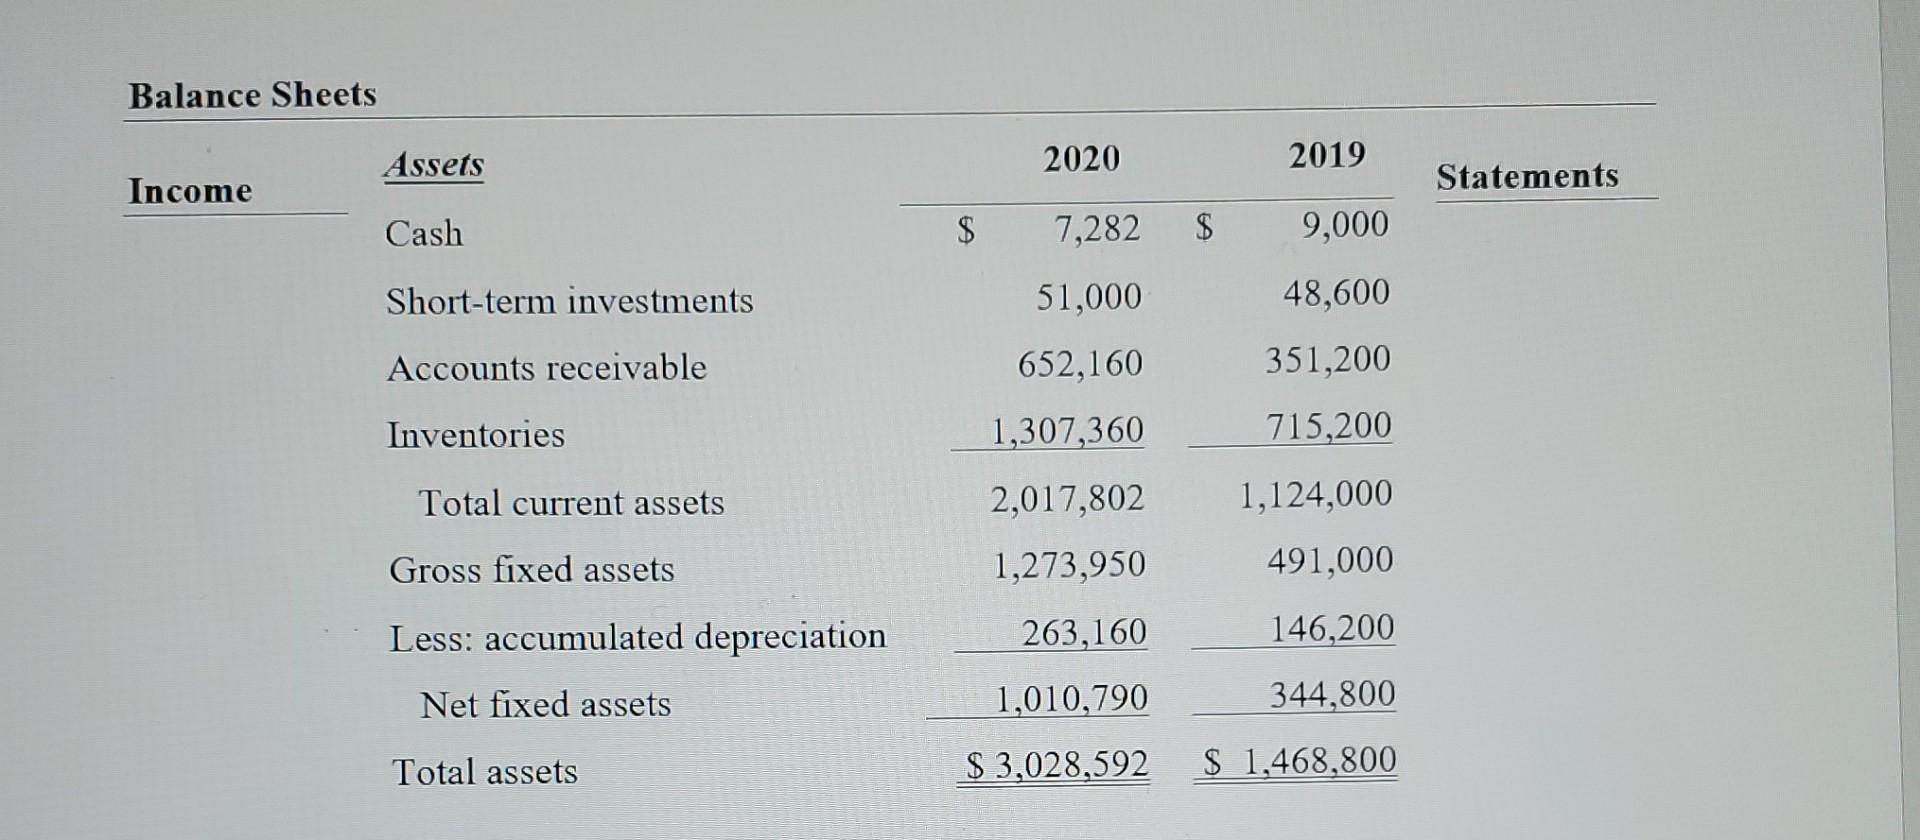
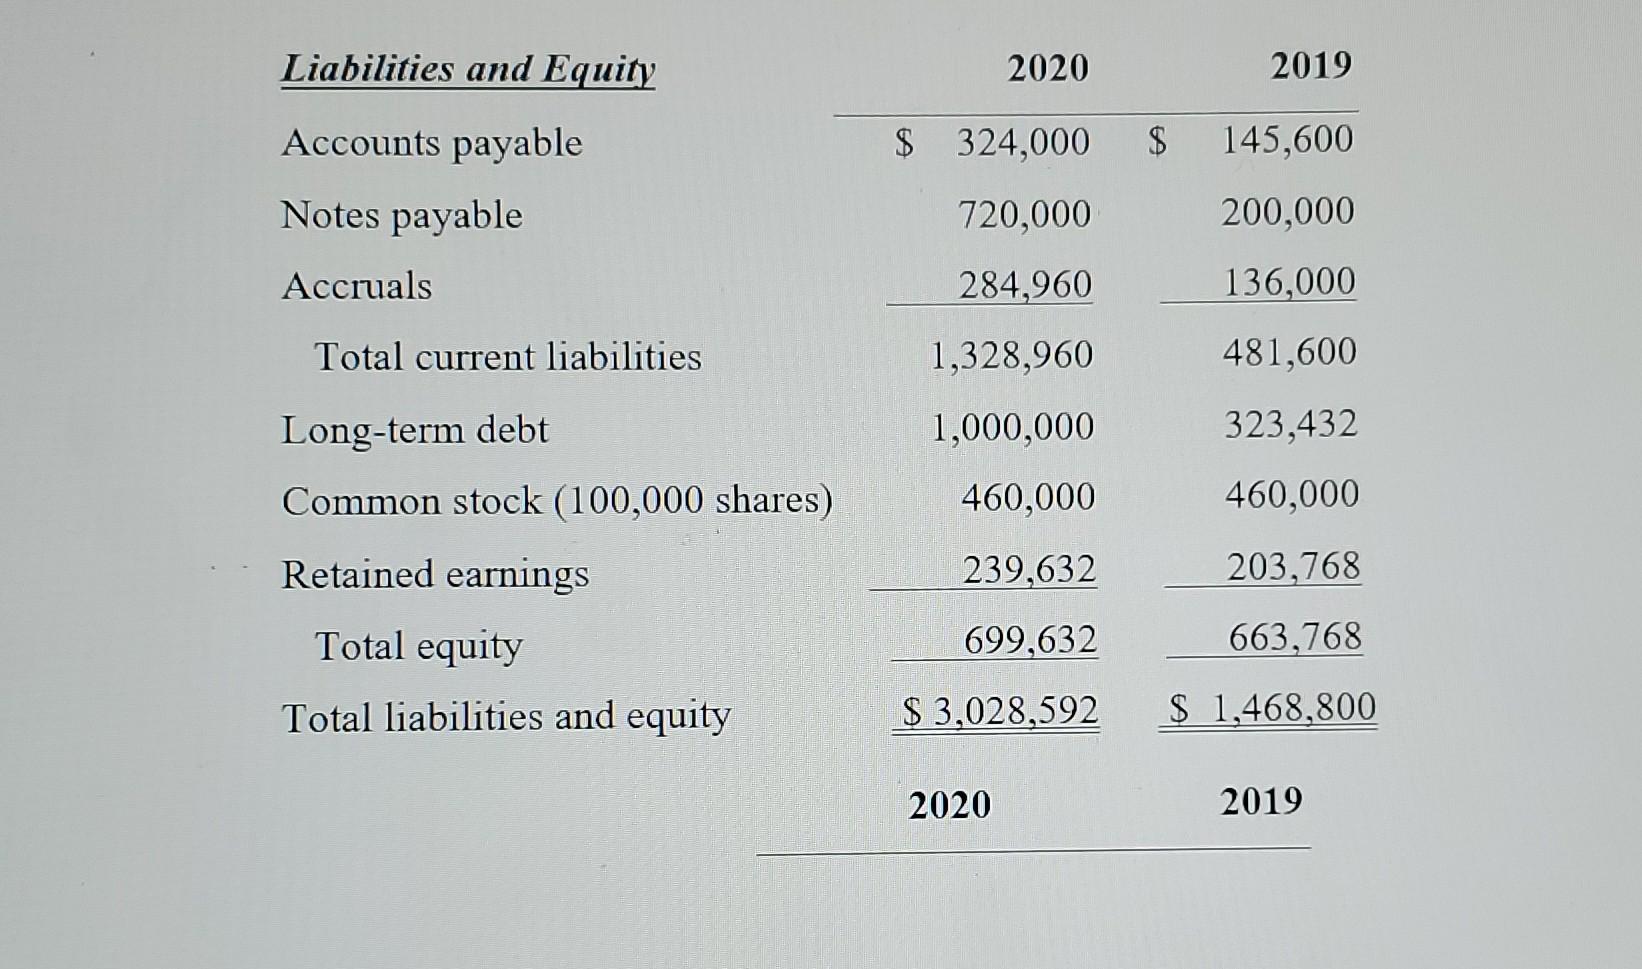
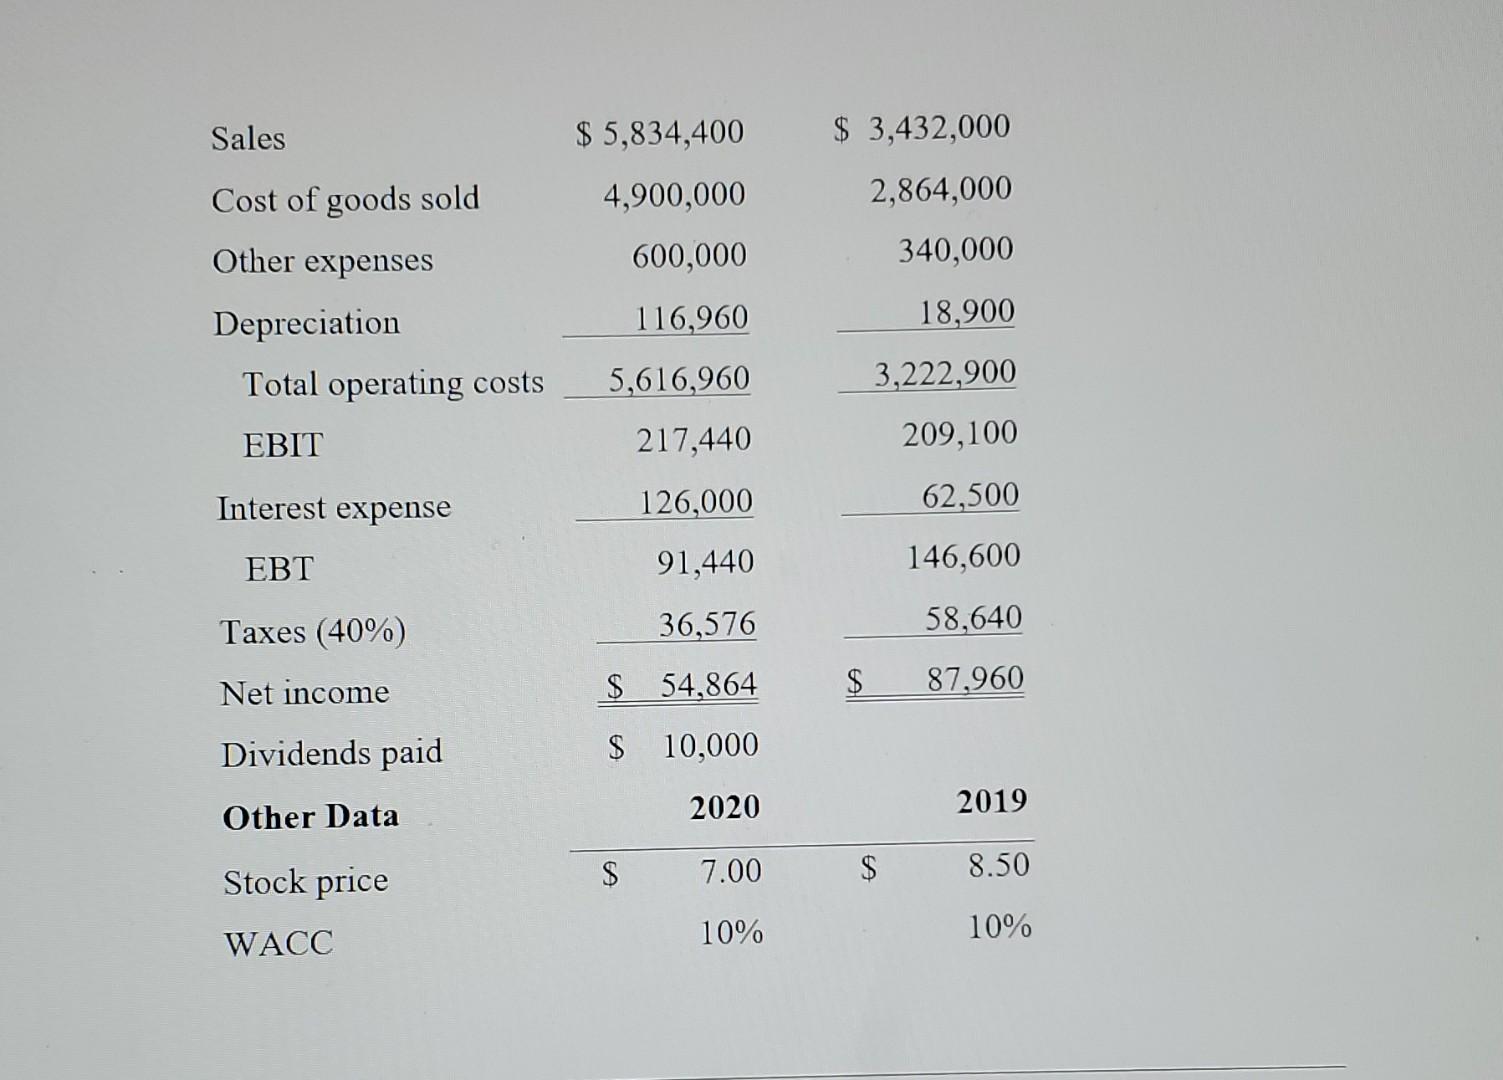
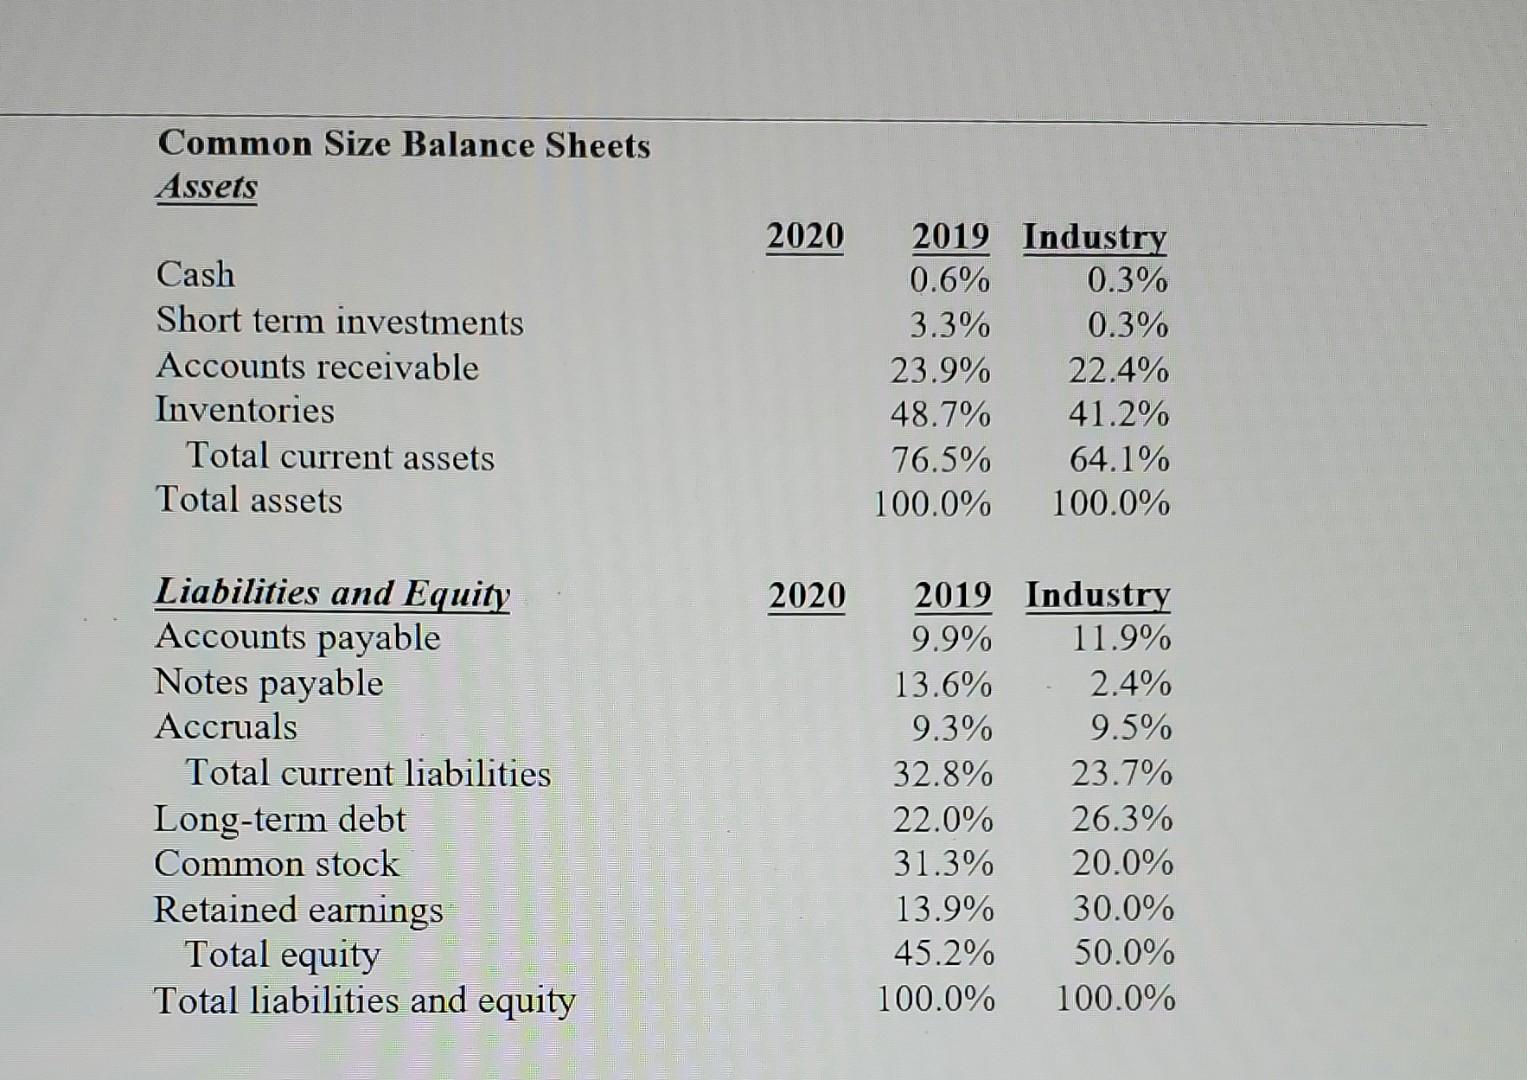
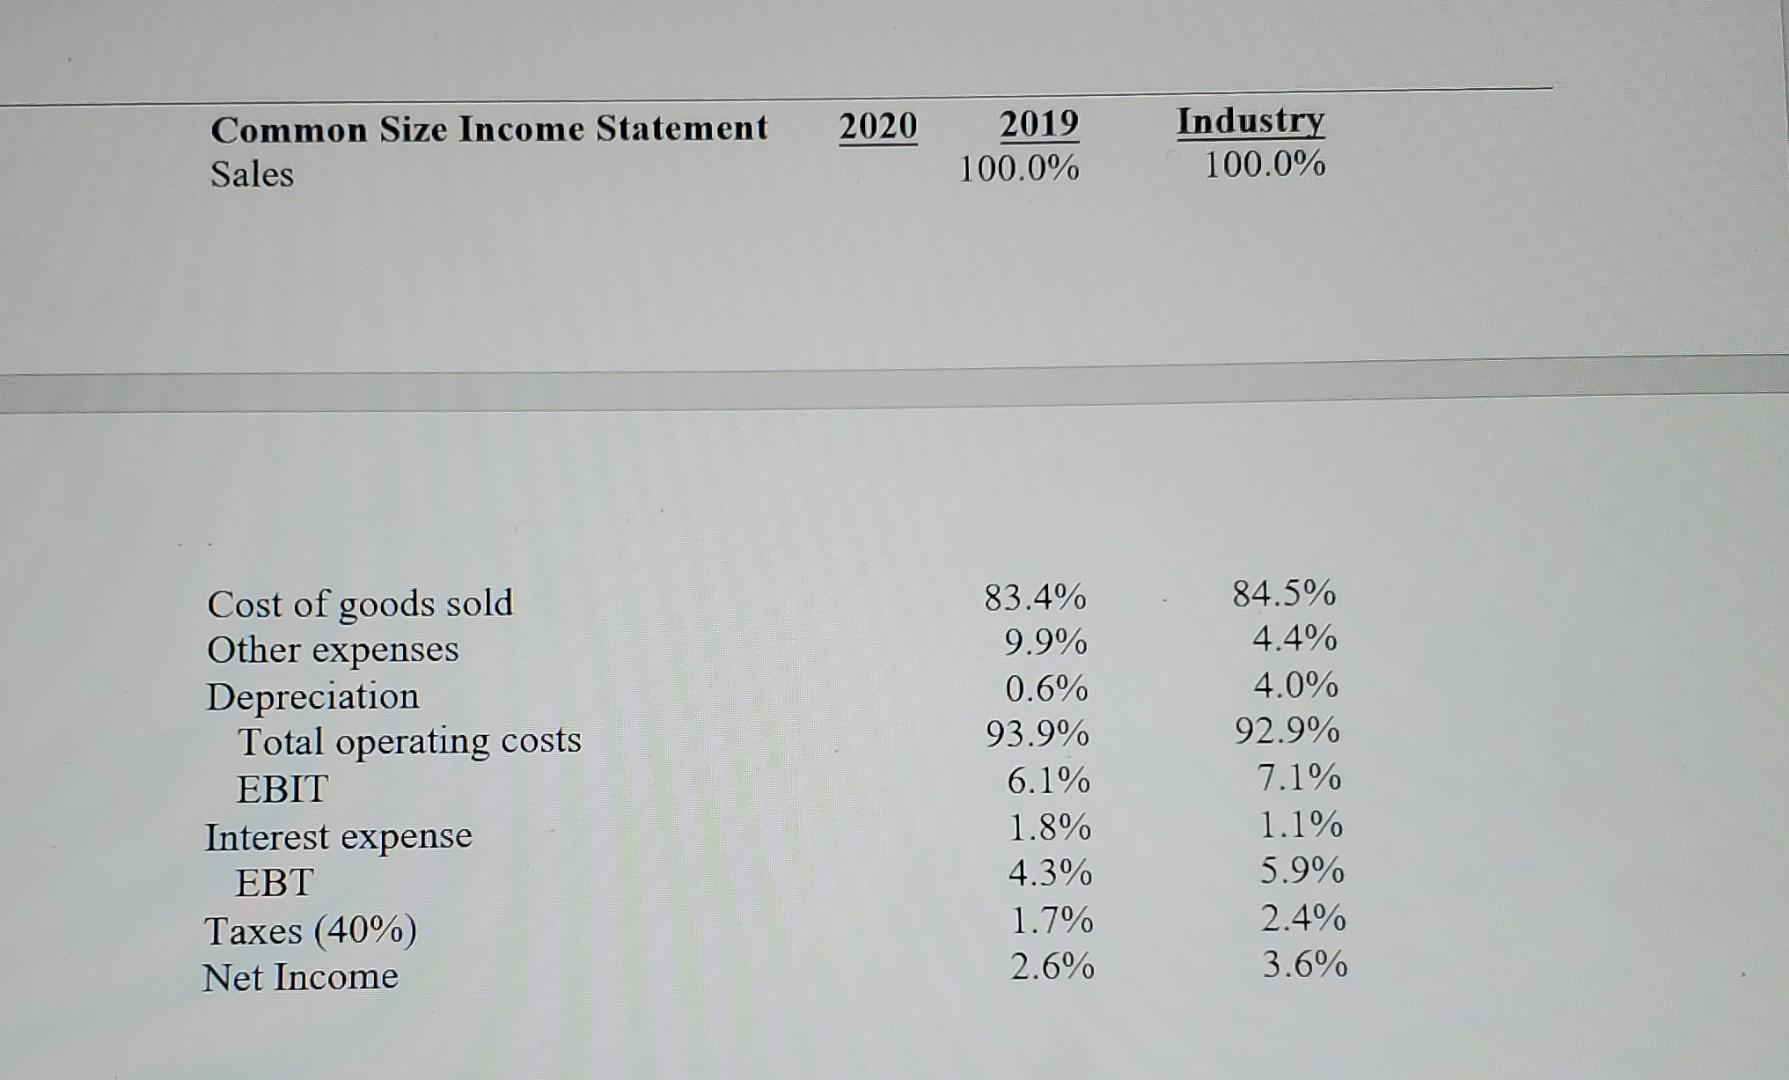
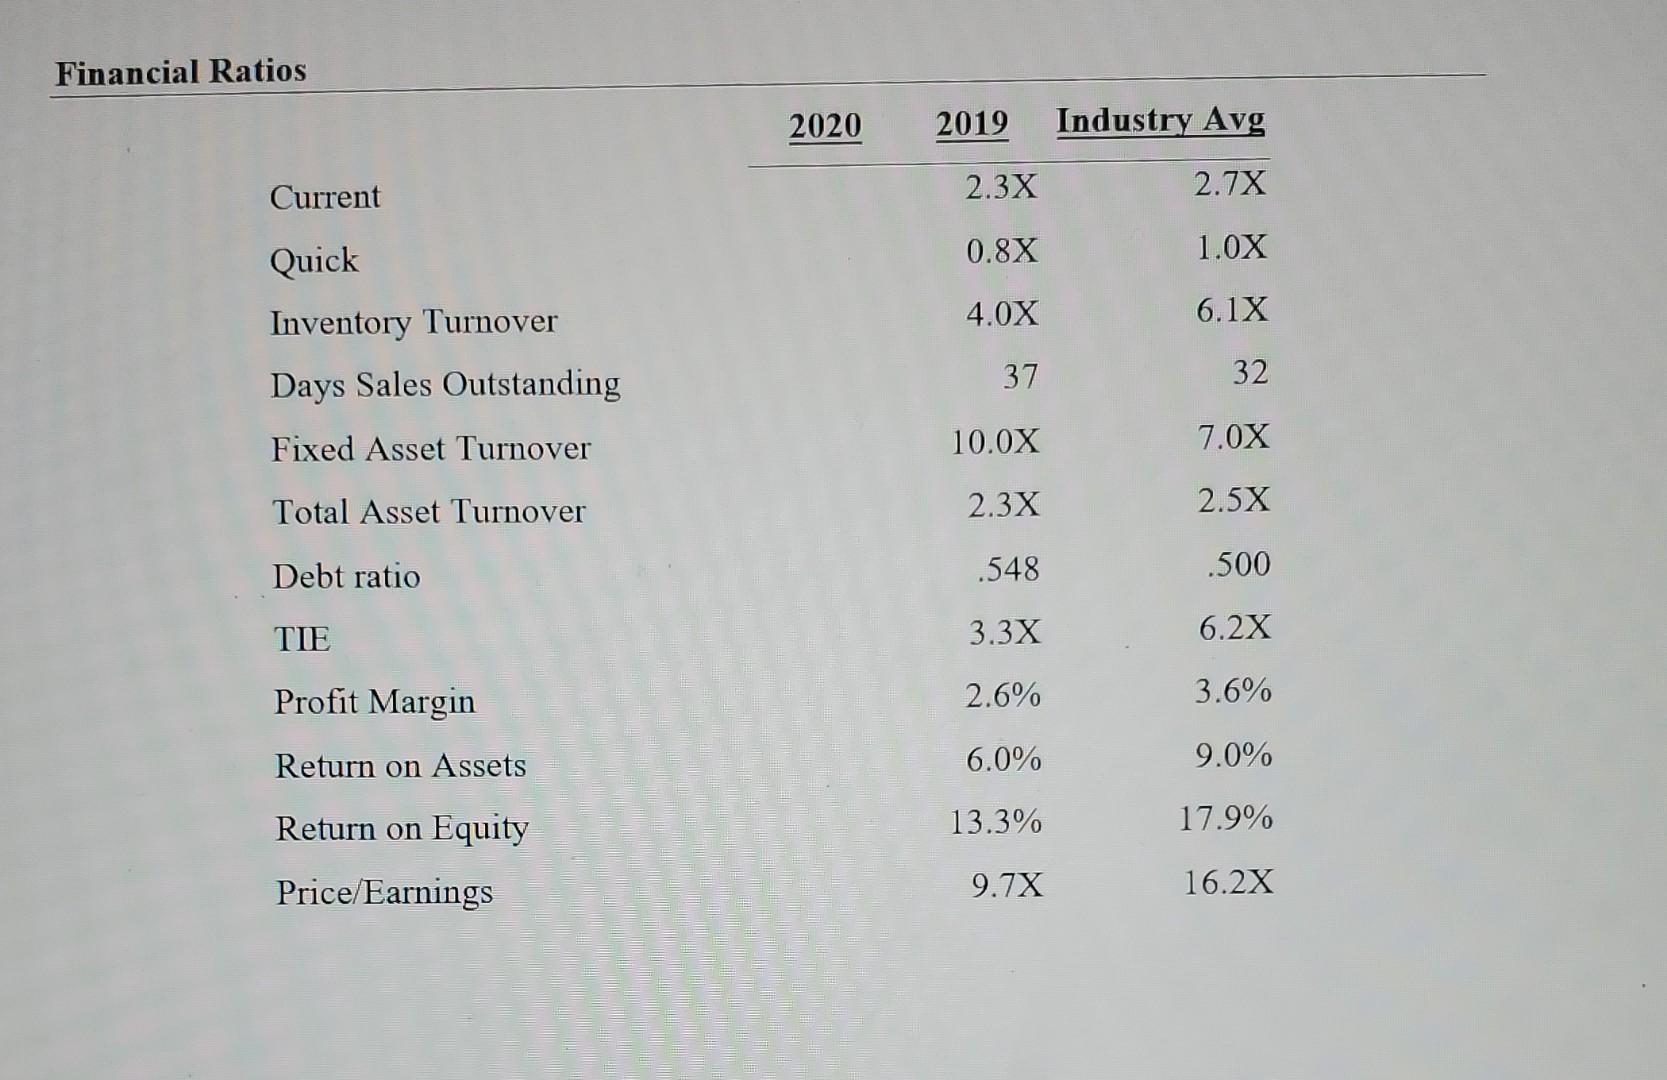
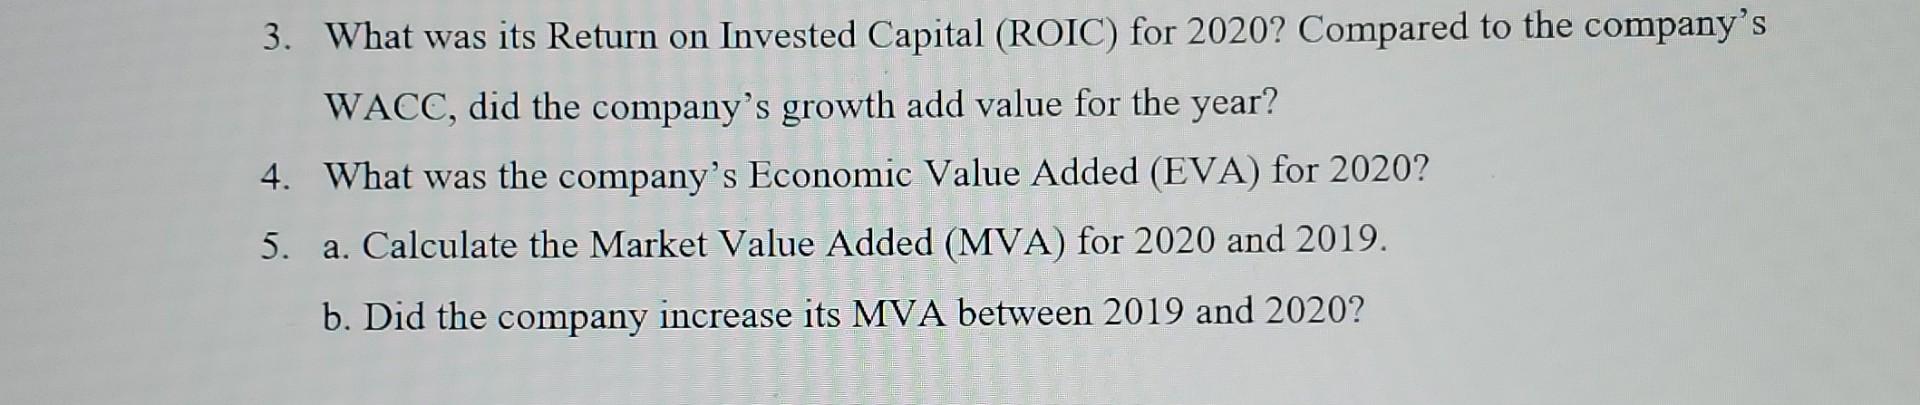
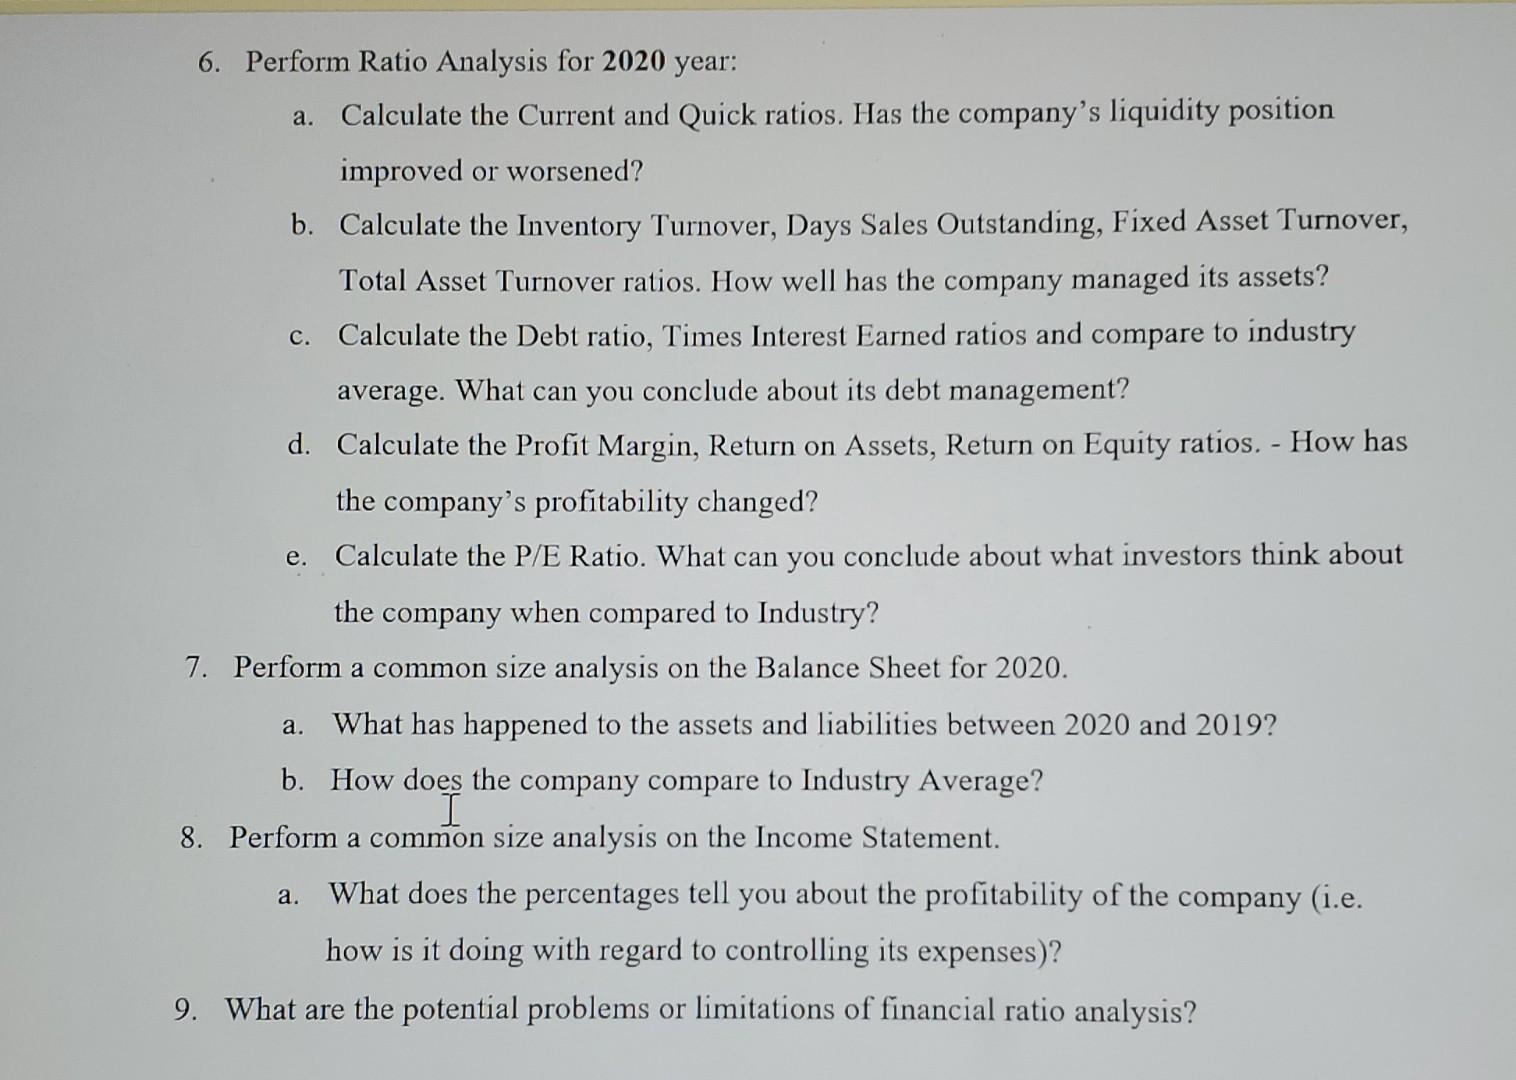
Finance 211 - Assignment #1 Submit your answers using the Assignment #1 Online link in Moodle There are 2 Parts to the Assignment Part A Financial Statement Analysis You have been hired to be the assistant to the Chief Financial Officer of RidgeRunner Mountain Bikes Inc.. The CFO has been asked to provide a report to the Board of Directors on the performance of the company for the 2020 year. The CFO has asked you to analyze the following financial data for the 2020 and 2019 years to help him answer the following questions. Balance Sheets Assets 2020 2019 Income Statements Cash $ 7,282 $ 9,000 51,000 48,600 Short-term investments Accounts receivable 652,160 351,200 Inventories 1,307,360 715,200 Total current assets 2,017,802 1,124,000 1,273,950 491,000 Gross fixed assets Less: accumulated depreciation Net fixed assets 263,160 146,200 1,010,790 344,800 Total assets $ 3,028,592 $ 1,468,800 Liabilities and Equity 2020 2019 Accounts payable $ 324,000 $ 145,600 Notes payable 720,000 200,000 Accruals 284,960 136,000 Total current liabilities 1,328,960 481,600 1,000,000 323,432 Long-term debt Common stock (100,000 shares) 460,000 460,000 Retained earnings 239,632 203,768 Total equity 699,632 663,768 Total liabilities and equity $ 3,028,592 $ 1,468,800 2020 2019 Sales $ 3,432,000 Cost of goods sold $ 5,834,400 4,900,000 600,000 2,864,000 Other expenses 340,000 116,960 18,900 Depreciation Total operating costs EBIT 5,616,960 3,222,900 217,440 209,100 Interest expense 126,000 62,500 EBT 91,440 146,600 Taxes (40%) 36,576 58,640 Net income $ 54,864 $ 87,960 Dividends paid $ 10,000 2020 2019 Other Data 7.00 8.50 Stock price WACC 10% 10% Common Size Balance Sheets Assets 2020 Cash Short term investments Accounts receivable Inventories Total current assets Total assets 2019 Industry 0.6% 0.3% 3.3% 0.3% 23.9% 22.4% 48.7% 41.2% 76.5% 64.1% 100.0% 100.0% 2020 Liabilities and Equity Accounts payable Notes payable Accruals Total current liabilities Long-term debt Common stock Retained earnings Total equity Total liabilities and equity 2019 Industry 9.9% 11.9% 13.6% 2.4% 9.3% 9.5% 32.8% 23.7% 22.0% 26.3% 31.3% 20.0% 13.9% 30.0% 45.2% 50.0% 100.0% 100.0% 2020 Common Size Income Statement Sales 2019 100.0% Industry 100.0% Cost of goods sold Other expenses Depreciation Total operating costs EBIT Interest expense EBT Taxes (40%) Net Income 83.4% 9.9% 0.6% 93.9% 6.1% 1.8% 4.3% 1.7% 2.6% 84.5% 4.4% 4.0% 92.9% 7.1% 1.1% 5.9% 2.4% 3.6% Financial Ratios 2020 2019 Industry Avg Current 2.3X 2.7x 0.8X 1.0X 4.0X 6.1X 37 32 Quick Inventory Turnover Days Sales Outstanding Fixed Asset Turnover Total Asset Turnover Debt ratio 10.0x 7.0X 2.3X 2.5X .548 .500 TIE 3.3X 6.2x Profit Margin 2.6% 3.6% Return on Assets 6.0% 9.0% 13.3% 17.9% Return on Equity Price/Earnings 9.7x 16.2X 3. What was its Return on Invested Capital (ROIC) for 2020? Compared to the company's WACC, did the company's growth add value for the year? 4. What was the company's Economic Value Added (EVA) for 2020? 5. a. Calculate the Market Value Added (MVA) for 2020 and 2019. b. Did the company increase its MVA between 2019 and 2020? 6. Perform Ratio Analysis for 2020 year: a. Calculate the Current and Quick ratios. Has the company's liquidity position improved or worsened? b. Calculate the Inventory Turnover, Days Sales Outstanding, Fixed Asset Turnover, Total Asset Turnover ratios. How well has the company managed its assets? c. Calculate the Debt ratio, Times Interest Earned ratios and compare to industry average. What can you conclude about its debt management? d. Calculate the Profit Margin, Return on Assets, Return on Equity ratios. - How has the company's profitability changed? e. Calculate the P/E Ratio. What can you conclude about what investors think about the company when compared to Industry? 7. Perform a common size analysis on the Balance Sheet for 2020. What has happened to the assets and liabilities between 2020 and 2019? b. How does the company compare to Industry Average? I 8. Perform a common size analysis on the Income Statement. a. What does the percentages tell you about the profitability of the company (i.e. how is it doing with regard to controlling its expenses)? 9. What are the potential problems or limitations of financial ratio analysis? a. Finance 211 - Assignment #1 Submit your answers using the Assignment #1 Online link in Moodle There are 2 Parts to the Assignment Part A Financial Statement Analysis You have been hired to be the assistant to the Chief Financial Officer of RidgeRunner Mountain Bikes Inc.. The CFO has been asked to provide a report to the Board of Directors on the performance of the company for the 2020 year. The CFO has asked you to analyze the following financial data for the 2020 and 2019 years to help him answer the following questions. Balance Sheets Assets 2020 2019 Income Statements Cash $ 7,282 $ 9,000 51,000 48,600 Short-term investments Accounts receivable 652,160 351,200 Inventories 1,307,360 715,200 Total current assets 2,017,802 1,124,000 1,273,950 491,000 Gross fixed assets Less: accumulated depreciation Net fixed assets 263,160 146,200 1,010,790 344,800 Total assets $ 3,028,592 $ 1,468,800 Liabilities and Equity 2020 2019 Accounts payable $ 324,000 $ 145,600 Notes payable 720,000 200,000 Accruals 284,960 136,000 Total current liabilities 1,328,960 481,600 1,000,000 323,432 Long-term debt Common stock (100,000 shares) 460,000 460,000 Retained earnings 239,632 203,768 Total equity 699,632 663,768 Total liabilities and equity $ 3,028,592 $ 1,468,800 2020 2019 Sales $ 3,432,000 Cost of goods sold $ 5,834,400 4,900,000 600,000 2,864,000 Other expenses 340,000 116,960 18,900 Depreciation Total operating costs EBIT 5,616,960 3,222,900 217,440 209,100 Interest expense 126,000 62,500 EBT 91,440 146,600 Taxes (40%) 36,576 58,640 Net income $ 54,864 $ 87,960 Dividends paid $ 10,000 2020 2019 Other Data 7.00 8.50 Stock price WACC 10% 10% Common Size Balance Sheets Assets 2020 Cash Short term investments Accounts receivable Inventories Total current assets Total assets 2019 Industry 0.6% 0.3% 3.3% 0.3% 23.9% 22.4% 48.7% 41.2% 76.5% 64.1% 100.0% 100.0% 2020 Liabilities and Equity Accounts payable Notes payable Accruals Total current liabilities Long-term debt Common stock Retained earnings Total equity Total liabilities and equity 2019 Industry 9.9% 11.9% 13.6% 2.4% 9.3% 9.5% 32.8% 23.7% 22.0% 26.3% 31.3% 20.0% 13.9% 30.0% 45.2% 50.0% 100.0% 100.0% 2020 Common Size Income Statement Sales 2019 100.0% Industry 100.0% Cost of goods sold Other expenses Depreciation Total operating costs EBIT Interest expense EBT Taxes (40%) Net Income 83.4% 9.9% 0.6% 93.9% 6.1% 1.8% 4.3% 1.7% 2.6% 84.5% 4.4% 4.0% 92.9% 7.1% 1.1% 5.9% 2.4% 3.6% Financial Ratios 2020 2019 Industry Avg Current 2.3X 2.7x 0.8X 1.0X 4.0X 6.1X 37 32 Quick Inventory Turnover Days Sales Outstanding Fixed Asset Turnover Total Asset Turnover Debt ratio 10.0x 7.0X 2.3X 2.5X .548 .500 TIE 3.3X 6.2x Profit Margin 2.6% 3.6% Return on Assets 6.0% 9.0% 13.3% 17.9% Return on Equity Price/Earnings 9.7x 16.2X 3. What was its Return on Invested Capital (ROIC) for 2020? Compared to the company's WACC, did the company's growth add value for the year? 4. What was the company's Economic Value Added (EVA) for 2020? 5. a. Calculate the Market Value Added (MVA) for 2020 and 2019. b. Did the company increase its MVA between 2019 and 2020? 6. Perform Ratio Analysis for 2020 year: a. Calculate the Current and Quick ratios. Has the company's liquidity position improved or worsened? b. Calculate the Inventory Turnover, Days Sales Outstanding, Fixed Asset Turnover, Total Asset Turnover ratios. How well has the company managed its assets? c. Calculate the Debt ratio, Times Interest Earned ratios and compare to industry average. What can you conclude about its debt management? d. Calculate the Profit Margin, Return on Assets, Return on Equity ratios. - How has the company's profitability changed? e. Calculate the P/E Ratio. What can you conclude about what investors think about the company when compared to Industry? 7. Perform a common size analysis on the Balance Sheet for 2020. What has happened to the assets and liabilities between 2020 and 2019? b. How does the company compare to Industry Average? I 8. Perform a common size analysis on the Income Statement. a. What does the percentages tell you about the profitability of the company (i.e. how is it doing with regard to controlling its expenses)? 9. What are the potential problems or limitations of financial ratio analysis? a
Step by Step Solution
There are 3 Steps involved in it
Step: 1

Get Instant Access to Expert-Tailored Solutions
See step-by-step solutions with expert insights and AI powered tools for academic success
Step: 2

Step: 3
Ace Your Homework with AI
Get the answers you need in no time with our AI-driven, step-by-step assistance
Get Started