Answered step by step
Verified Expert Solution
Link Copied!

Question

1 Approved Answer

Financial Analysis 2015 3% 2014 3% 2013 3% 2012 4% 2011 2% Return on Sales Return on Equity 16% 16% 11% 18% 7% Average Collection
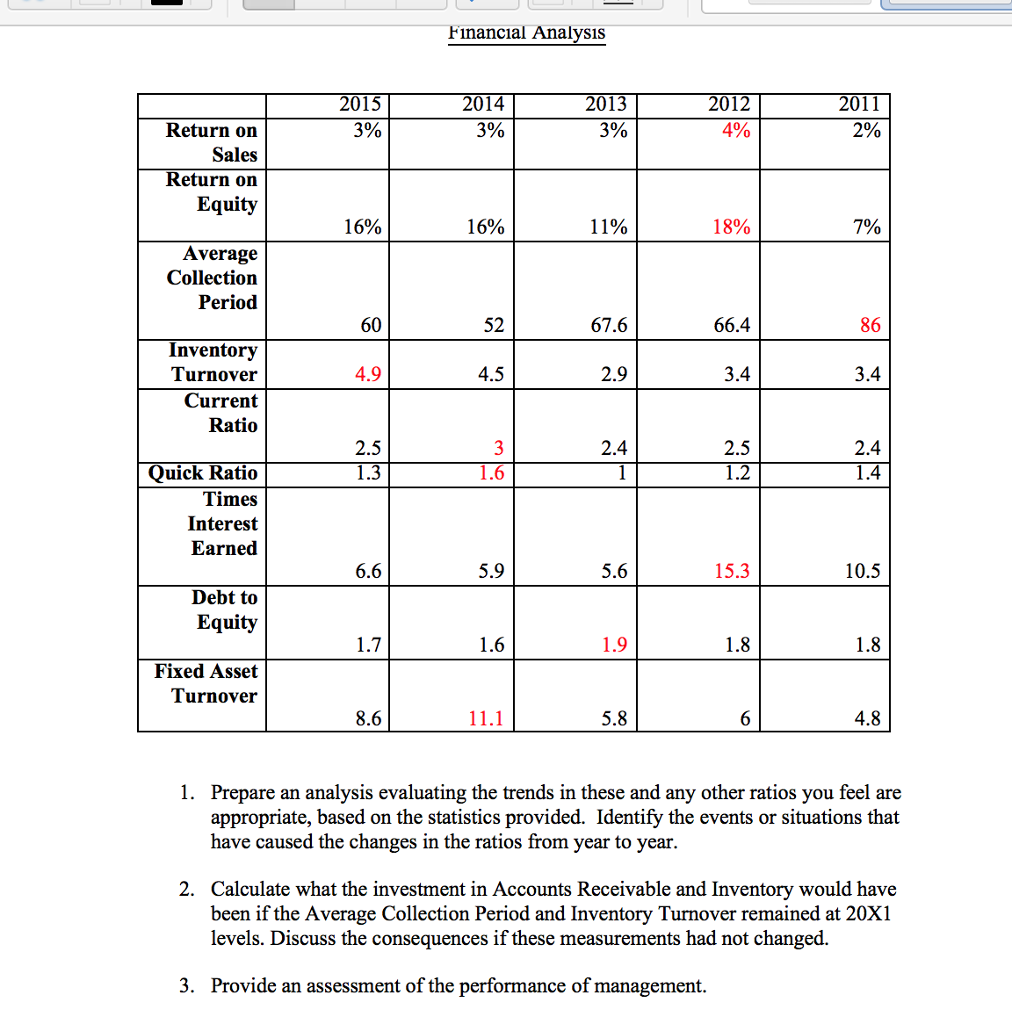
image text in transcribed

Financial Analysis 2015 3% 2014 3% 2013 3% 2012 4% 2011 2% Return on Sales Return on Equity 16% 16% 11% 18% 7% Average Collection Period 60 52 67.6 66.4 86 Inventory Turnover Current Ratio 4.9 4.5 2.9 3.4 3.4 2.5 2.4 2.5 2.4 Quick Ratio Times Interest Earned 6.6 5.9 5.6 15.3 10.5 Debt to Equity 1.7 1.9 Fixed Asset Turnover 8.6 11.1 5.8 4.8 1. Prepare an analysis evaluating the trends in these and any other ratios you feel are appropriate, based on the statistics provided. Identify the events or situations that have caused the changes in the ratios from year to year. 2. Calculate what the investment in Accounts Receivable and Inventory would have been if the Average Collection Period and Inventory Turnover remained at 20X1 levels. Discuss the consequences if these measurements had not changed. 3. Provide an assessment of the performance of management

Step by Step Solution

There are 3 Steps involved in it

Step: 1

blur-text-image

Get Instant Access to Expert-Tailored Solutions

See step-by-step solutions with expert insights and AI powered tools for academic success

Step: 2

blur-text-image

Step: 3

blur-text-image

Ace Your Homework with AI

Get the answers you need in no time with our AI-driven, step-by-step assistance

Get Started

Recommended Textbook for

Market Liquidity Theory Evidence And Policy

Authors: Thierry Foucault, Marco Pagano, Ailsa Roell

1st Edition

0199936242, 978-0199936243

More Books

Students also viewed these Finance questions

Question

How is a bond like a loan?

Answered: 1 week ago

Question

4. Drafting

Answered: 1 week ago