Question
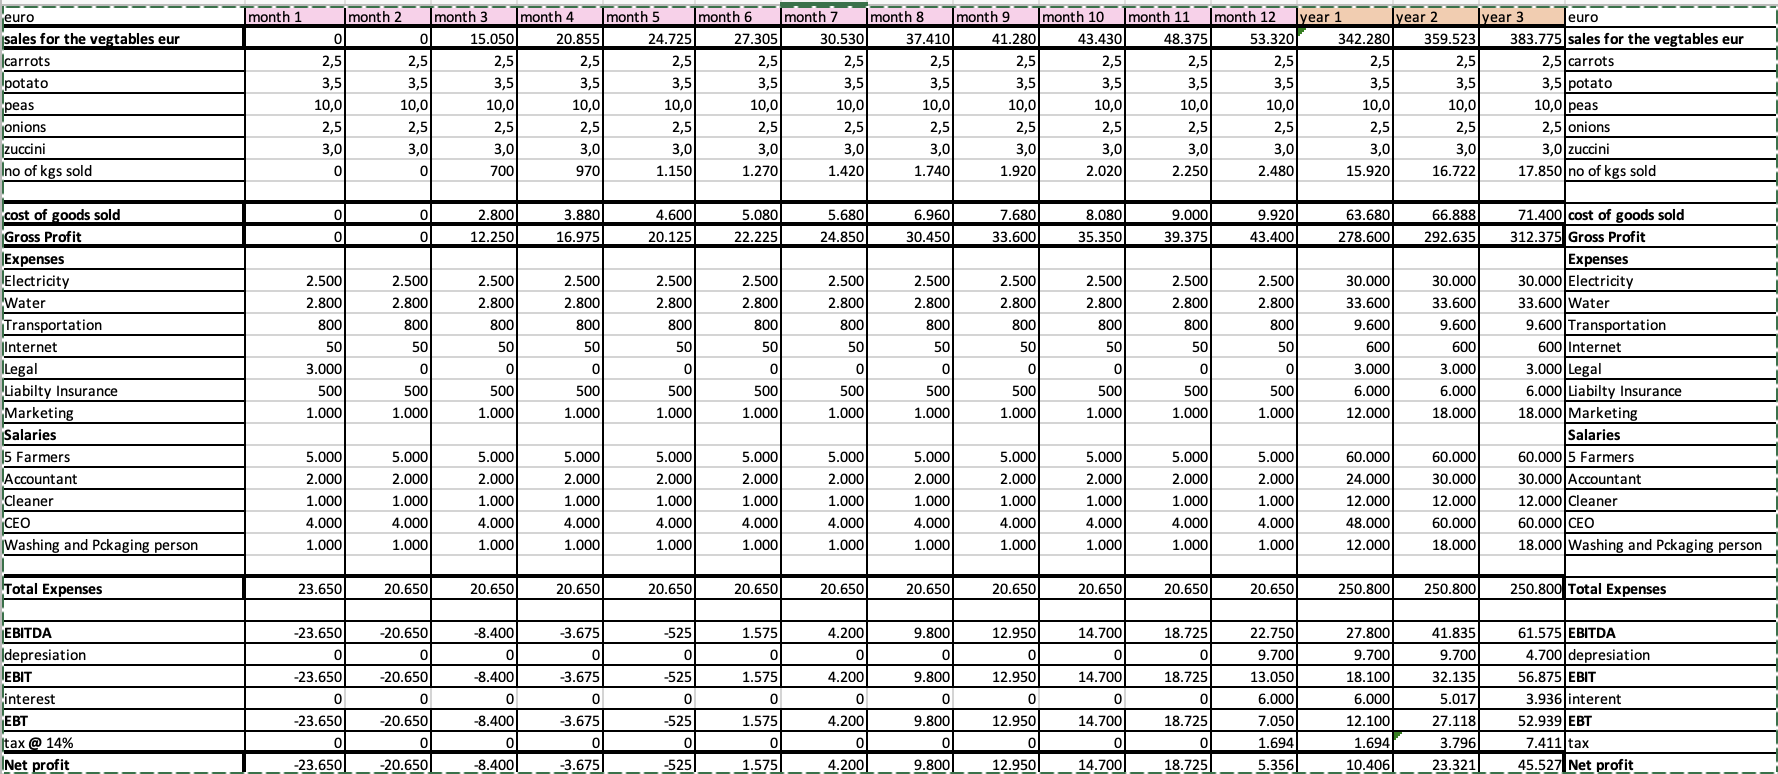
Financial analysis and financial plan of the following business idea based on the financials above. Vegetables are one the products that are most used in


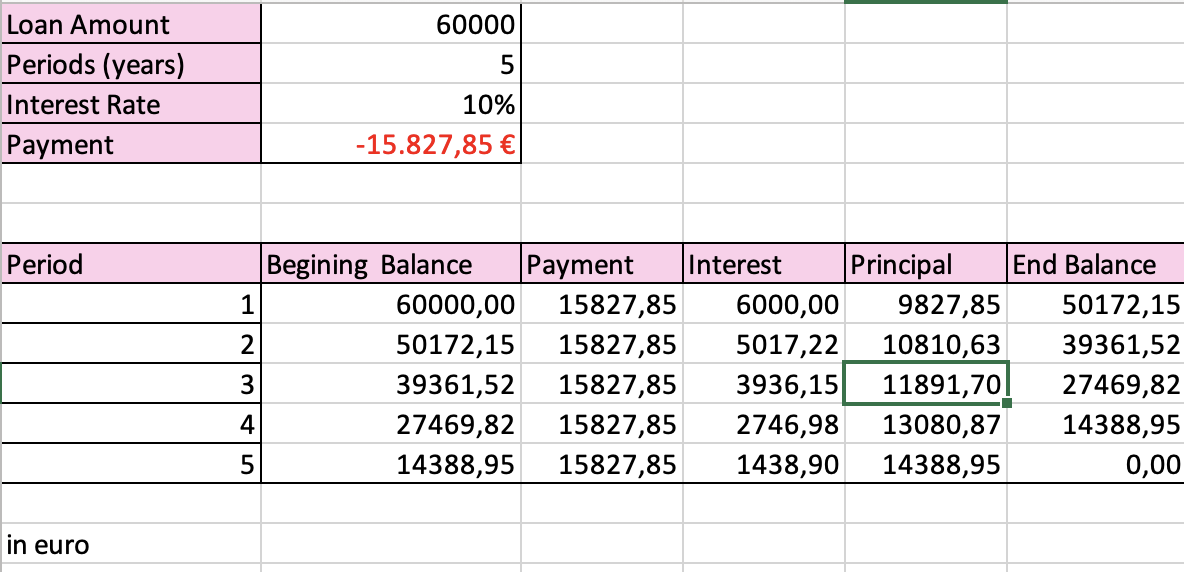
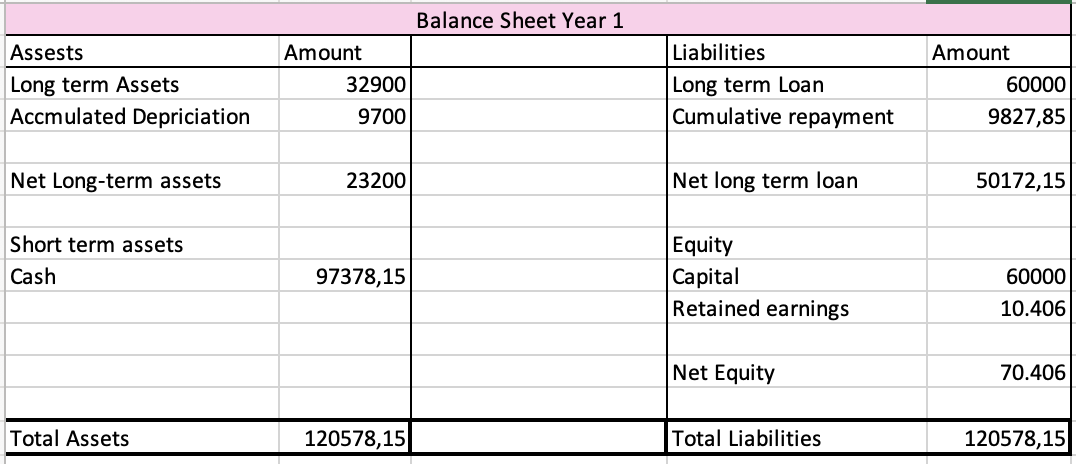
Financial analysis and financial plan of the following business idea based on the financials above.
Vegetables are one the products that are most used in the making of dishes, they are used for broths, purees, souses and other parts of dishes. Differently, the main purpose of micro fruits and vegetables, due to their small size, is decoration. Most high-end restaurants in Spain are demanding of micro vegetables for their dish creations. This product with a high quality is not that easy to find. The idea is to use the preexisting greenhouses that are family owned and not being used to produce specifically what each restaurant wants. At the beginning the company would already have several green houses with an area of 620 square meters each. The in-season products will be cultivated outside in the crop fields that are also already owned. Due to the profile of the target client our products have a BIO certification accredited by CCPAE. At the beginning we would be cultivating many different products to allocate what works specifically for the clients, taking into consideration their current needs and possible future necessities.
month 1 euro sales for the vegtables eur carrots potato peas onions Izuccini Ino of kgs sold month 2 month 3 month 4 month 5 month 6 month 7 month 8 month 9 month 10 month 11 month 12 Lyear 1 lyear 2 Iyear 3 euro 0 0 15.050 20.855 24.725 27.305 30.530 37.410 41.280 43.430 48.375 53.320 342.280 359.523 383.775 sales for the vegtables eur 2,5 2,5 2,5 2,5 2,5 2,5 2,5 2,5 2,5 2,5 2,51 2,5 2,5 2,5 2.5 carrots 3,5 3,5 3,5 3,5 3,5 3,5 3,5 3,5 3,5 3,5 3,5 3,5 3,5 3,5 3,5 potato 10,0 10,0 10,0 10,0 10,0 10,0 10,0 10,0 10,0 10,0 10,01 10,0 10,0 10,01 10,0 peas 2,51 2,5 2,5 2,5 2,5 2,5 2,5 2,5 2,5 2,5 2,5 2,5 2,5 2,5 2,5 onions 3,0 3,0 3,0 3,0 3,01 3,0 3,01 3,0 3,0 3,01 3,0 3,0 3,0 3,01 3,0/zuccini 0 0 700 970 1.150 1.270 1.420 1.740 1.920 2.020 2.2501 2.480 15.920 16.722 17.850 no of kgs sold 0 2.800 12.250 3.880 16.975 4.600 20.125 5.080 22.225 5.6801 24.850 6.960 30.450 7.680 33.600 8.080 35.350 9.000 39.375 9.920 43.400 63.680 278.600 66.888 292.635 0 2.500 2.800 800 2.500 2.800 800 2.500 2.800 2.500 2.800 800 2.500 2.800 2.500 2.800 800 2.500 2.800 800 2.500 2.800 800 2.500 2.800 2.500 2.800 2.500 2.800 800 50 800 800 800 800 50 50 50 50 50 50 50 50 50 2.500 2.800 800) 501 0 5001 1.0001 30.000 33.600 9.600 600 3.000 6.000 12.000 0 cost of goods sold Gross Profit JExpenses Electricity Water Transportation Internet Legal Liabilty Insurance Marketing Salaries 15 Farmers Accountant Cleaner CEO Washing and Pckaging person 30.000 33.6001 9.600 600 3.000) 6.000 18.000 0 50 3.000 500 1.000 0 0 500 1.000 500 1.000 0 500 1.000 500 1.000 0 500 1.000 0 5001 1.000 71.400 cost of goods sold 312.375 Gross Profit Expenses 30.000 Electricity 33.600 Water 9.600 Transportation 600 Internet 3.000 Legal 6.000 Liabilty Insurance 18.000 Marketing Salaries 60.000 5 Farmers 30.000 Accountant 12.000 Cleaner 60.000 CEO 18.000 Washing and Pckaging person 0 500 1.000 0 5001 1.000 0 500 1.000 500 1.000 5.000 2.000 1.000 4.000 1.000 5.000 2.000 1.000 4.000 1.000 5.000 2.000 1.000 4.000 1.000 5.000 2.000 1.000 4.000 1.000 5.000 2.000 1.000 4.000 1.000 5.000 2.000 1.000 4.000 1.000 5.000 2.000 1.000 4.000 1.000 5.000 2.000 1.000 4.000 1.000 5.000 2.000 1.000 4.000 5.000 2.000 1.000 4.000 1.000 5.000 2.0001 1.000 4.000 1.000 5.000 2.000 1.000 4.000 1.000 60.000 24.000 12.000 48.000 12.000 60.000 30.000 12.0001 60.000 18.000 1.000 Total Expenses 23.650 20.650 20.650 20.650 20.650 20.650 20.650 20.650 20.650 20.650 20.650 20.650 250.800 250.800 250.800 Total Expenses -23.650 -8.400 -3.675 -525 1.575 4.200 9.800 12.950 14.700 18.7251 0 -20.650 0 -20.650 0 0 0 0 0 0 -3.675 0 1.575 0 18.725 -525 0 9.800 0 EBITDA Idepresiation EBIT interest EBT tax @ 14% INet profit 14.700 0 0 0 0 0 0 -23.650 0 -23.650 0 -23.650 -8.400 0 -8.400 0 -8.4001 22.750 9.700 13.050 6.000 7.050 1.694 5.356 27.800 9.700 18.100 6.000 12.100 1.694 10.406 41.835 9.700 32.135 5.017 27.118 3.796 23.3211 4.200 0 4.2001 ol 4.200 -20.650 0 -20.650 61.575 EBITDA 4.700 depresiation 56.875 EBIT 3.936|interent 52.939 EBT 7.411 tax 45.527 Net profit 12.950 0 12.9501 ol 12.9501 -3.675 0 -3.675 14.700 -5251 0 -525) 1.575 0 1.575 9.800 0 0 18.725 ol 18.7251 9.800 14.700 euro tractor (5 years) sprinkler (2 years) computer (3years) table (5 years) chair (5 years) value 20000 10000 900 yeraly depreciation 4000 5000 300 200 200 1000 1000 euro DEP year 1 DEP year 2 DEP year 3 residual value year 2 12000 residual value year 3 8000 4000 initial value 20000 10000 900 4000 0 0 0 5000 300 residual value year 1 16000 5000 600 800 800 tractor sprinkler computer table chair Total 4000 5000 300 200 200 0 1000 1000 200 200 300 600 600 300 200 200 4700 400 00 32900 9700 32200 9700 13500 8800 Loan Amount Periods (years) Interest Rate Payment 60000 5 10% -15.827,85 Period Begining Balance Payment Interest Principal End Balance 1 60000,00 15827,85 6000,00 9827,85 50172,15 2 50172,15 15827,85 5017,22 10810,63 39361,52 3 39361,52 15827,85 3936,15 11891,701 27469,82 4 27469,82 15827,85 2746,98 13080,87 14388,95 5 14388,95 15827,85 1438,90 14388,95 0,00 in euro Account month 1 month 2 month 3 month 4 month 5 month 6 month 7 month 8 month 9 month 10 month 11 month 12 Year 1 Year 2 Year 3 Cash at the beginning of the period 0 63450 42800 34400 30725 30200 31775 35975 45775 58725 73425 92150 0 97378,15 119588,81 Cashflow from Operation Net Profit Depreciation -23650 -20650 -8400 -3675 -525 1575 4200 9800 12950 14700 18725 5356 9700 10406 9700 23321,30 9700,00 45527,41 4700,00 Total Cashflow from Operation -23650 -20650 -8400 -3675 -525 1575 4200 9800 12950 14700 18725 15056 20106 33021,30 50227,41 Cash flow from Investment Cash requirement Cumulative Cash Requirement 32900 -56550 -56550 -20650 -77200 -8400 -85600 -3675 -89275 -525 -89800 1575 -88225 4200 -84025 9800 -74225 12950 -61275 14700 -46575 18725 -27850 15056 -12794 32900 -12794 -25588 33021,30 7433,30 50227,41 57660,70 Cashflow from Financing Cash from equity Cash loan in Cash Loan out 120000 60000 60000 0 60000 60000 9827,85 9827,85 10810,63 11891,70 Cash at the end of the period 63450 42800 34400 30725 30200 31775 35975 45775 58725 73425 92150 97378,15 97378,15 119588,81 157924,52 in euro Balance Sheet Year 1 Assests Long term Assets Accmulated Depriciation Amount 32900 9700 Liabilities Long term Loan Cumulative repayment Amount 60000 9827,85 Net Long-term assets 23200 Net long term loan 50172,15 Short term assets Cash 97378,15 Equity Capital Retained earnings 60000 10.406 Net Equity 70.406 Total Assets 120578,15 Total Liabilities 120578,15 month 1 euro sales for the vegtables eur carrots potato peas onions Izuccini Ino of kgs sold month 2 month 3 month 4 month 5 month 6 month 7 month 8 month 9 month 10 month 11 month 12 Lyear 1 lyear 2 Iyear 3 euro 0 0 15.050 20.855 24.725 27.305 30.530 37.410 41.280 43.430 48.375 53.320 342.280 359.523 383.775 sales for the vegtables eur 2,5 2,5 2,5 2,5 2,5 2,5 2,5 2,5 2,5 2,5 2,51 2,5 2,5 2,5 2.5 carrots 3,5 3,5 3,5 3,5 3,5 3,5 3,5 3,5 3,5 3,5 3,5 3,5 3,5 3,5 3,5 potato 10,0 10,0 10,0 10,0 10,0 10,0 10,0 10,0 10,0 10,0 10,01 10,0 10,0 10,01 10,0 peas 2,51 2,5 2,5 2,5 2,5 2,5 2,5 2,5 2,5 2,5 2,5 2,5 2,5 2,5 2,5 onions 3,0 3,0 3,0 3,0 3,01 3,0 3,01 3,0 3,0 3,01 3,0 3,0 3,0 3,01 3,0/zuccini 0 0 700 970 1.150 1.270 1.420 1.740 1.920 2.020 2.2501 2.480 15.920 16.722 17.850 no of kgs sold 0 2.800 12.250 3.880 16.975 4.600 20.125 5.080 22.225 5.6801 24.850 6.960 30.450 7.680 33.600 8.080 35.350 9.000 39.375 9.920 43.400 63.680 278.600 66.888 292.635 0 2.500 2.800 800 2.500 2.800 800 2.500 2.800 2.500 2.800 800 2.500 2.800 2.500 2.800 800 2.500 2.800 800 2.500 2.800 800 2.500 2.800 2.500 2.800 2.500 2.800 800 50 800 800 800 800 50 50 50 50 50 50 50 50 50 2.500 2.800 800) 501 0 5001 1.0001 30.000 33.600 9.600 600 3.000 6.000 12.000 0 cost of goods sold Gross Profit JExpenses Electricity Water Transportation Internet Legal Liabilty Insurance Marketing Salaries 15 Farmers Accountant Cleaner CEO Washing and Pckaging person 30.000 33.6001 9.600 600 3.000) 6.000 18.000 0 50 3.000 500 1.000 0 0 500 1.000 500 1.000 0 500 1.000 500 1.000 0 500 1.000 0 5001 1.000 71.400 cost of goods sold 312.375 Gross Profit Expenses 30.000 Electricity 33.600 Water 9.600 Transportation 600 Internet 3.000 Legal 6.000 Liabilty Insurance 18.000 Marketing Salaries 60.000 5 Farmers 30.000 Accountant 12.000 Cleaner 60.000 CEO 18.000 Washing and Pckaging person 0 500 1.000 0 5001 1.000 0 500 1.000 500 1.000 5.000 2.000 1.000 4.000 1.000 5.000 2.000 1.000 4.000 1.000 5.000 2.000 1.000 4.000 1.000 5.000 2.000 1.000 4.000 1.000 5.000 2.000 1.000 4.000 1.000 5.000 2.000 1.000 4.000 1.000 5.000 2.000 1.000 4.000 1.000 5.000 2.000 1.000 4.000 1.000 5.000 2.000 1.000 4.000 5.000 2.000 1.000 4.000 1.000 5.000 2.0001 1.000 4.000 1.000 5.000 2.000 1.000 4.000 1.000 60.000 24.000 12.000 48.000 12.000 60.000 30.000 12.0001 60.000 18.000 1.000 Total Expenses 23.650 20.650 20.650 20.650 20.650 20.650 20.650 20.650 20.650 20.650 20.650 20.650 250.800 250.800 250.800 Total Expenses -23.650 -8.400 -3.675 -525 1.575 4.200 9.800 12.950 14.700 18.7251 0 -20.650 0 -20.650 0 0 0 0 0 0 -3.675 0 1.575 0 18.725 -525 0 9.800 0 EBITDA Idepresiation EBIT interest EBT tax @ 14% INet profit 14.700 0 0 0 0 0 0 -23.650 0 -23.650 0 -23.650 -8.400 0 -8.400 0 -8.4001 22.750 9.700 13.050 6.000 7.050 1.694 5.356 27.800 9.700 18.100 6.000 12.100 1.694 10.406 41.835 9.700 32.135 5.017 27.118 3.796 23.3211 4.200 0 4.2001 ol 4.200 -20.650 0 -20.650 61.575 EBITDA 4.700 depresiation 56.875 EBIT 3.936|interent 52.939 EBT 7.411 tax 45.527 Net profit 12.950 0 12.9501 ol 12.9501 -3.675 0 -3.675 14.700 -5251 0 -525) 1.575 0 1.575 9.800 0 0 18.725 ol 18.7251 9.800 14.700 euro tractor (5 years) sprinkler (2 years) computer (3years) table (5 years) chair (5 years) value 20000 10000 900 yeraly depreciation 4000 5000 300 200 200 1000 1000 euro DEP year 1 DEP year 2 DEP year 3 residual value year 2 12000 residual value year 3 8000 4000 initial value 20000 10000 900 4000 0 0 0 5000 300 residual value year 1 16000 5000 600 800 800 tractor sprinkler computer table chair Total 4000 5000 300 200 200 0 1000 1000 200 200 300 600 600 300 200 200 4700 400 00 32900 9700 32200 9700 13500 8800 Loan Amount Periods (years) Interest Rate Payment 60000 5 10% -15.827,85 Period Begining Balance Payment Interest Principal End Balance 1 60000,00 15827,85 6000,00 9827,85 50172,15 2 50172,15 15827,85 5017,22 10810,63 39361,52 3 39361,52 15827,85 3936,15 11891,701 27469,82 4 27469,82 15827,85 2746,98 13080,87 14388,95 5 14388,95 15827,85 1438,90 14388,95 0,00 in euro Account month 1 month 2 month 3 month 4 month 5 month 6 month 7 month 8 month 9 month 10 month 11 month 12 Year 1 Year 2 Year 3 Cash at the beginning of the period 0 63450 42800 34400 30725 30200 31775 35975 45775 58725 73425 92150 0 97378,15 119588,81 Cashflow from Operation Net Profit Depreciation -23650 -20650 -8400 -3675 -525 1575 4200 9800 12950 14700 18725 5356 9700 10406 9700 23321,30 9700,00 45527,41 4700,00 Total Cashflow from Operation -23650 -20650 -8400 -3675 -525 1575 4200 9800 12950 14700 18725 15056 20106 33021,30 50227,41 Cash flow from Investment Cash requirement Cumulative Cash Requirement 32900 -56550 -56550 -20650 -77200 -8400 -85600 -3675 -89275 -525 -89800 1575 -88225 4200 -84025 9800 -74225 12950 -61275 14700 -46575 18725 -27850 15056 -12794 32900 -12794 -25588 33021,30 7433,30 50227,41 57660,70 Cashflow from Financing Cash from equity Cash loan in Cash Loan out 120000 60000 60000 0 60000 60000 9827,85 9827,85 10810,63 11891,70 Cash at the end of the period 63450 42800 34400 30725 30200 31775 35975 45775 58725 73425 92150 97378,15 97378,15 119588,81 157924,52 in euro Balance Sheet Year 1 Assests Long term Assets Accmulated Depriciation Amount 32900 9700 Liabilities Long term Loan Cumulative repayment Amount 60000 9827,85 Net Long-term assets 23200 Net long term loan 50172,15 Short term assets Cash 97378,15 Equity Capital Retained earnings 60000 10.406 Net Equity 70.406 Total Assets 120578,15 Total Liabilities 120578,15Step by Step Solution
There are 3 Steps involved in it
Step: 1

Get Instant Access to Expert-Tailored Solutions
See step-by-step solutions with expert insights and AI powered tools for academic success
Step: 2

Step: 3

Ace Your Homework with AI
Get the answers you need in no time with our AI-driven, step-by-step assistance
Get Started


