 Financial Analysis
First bullet point
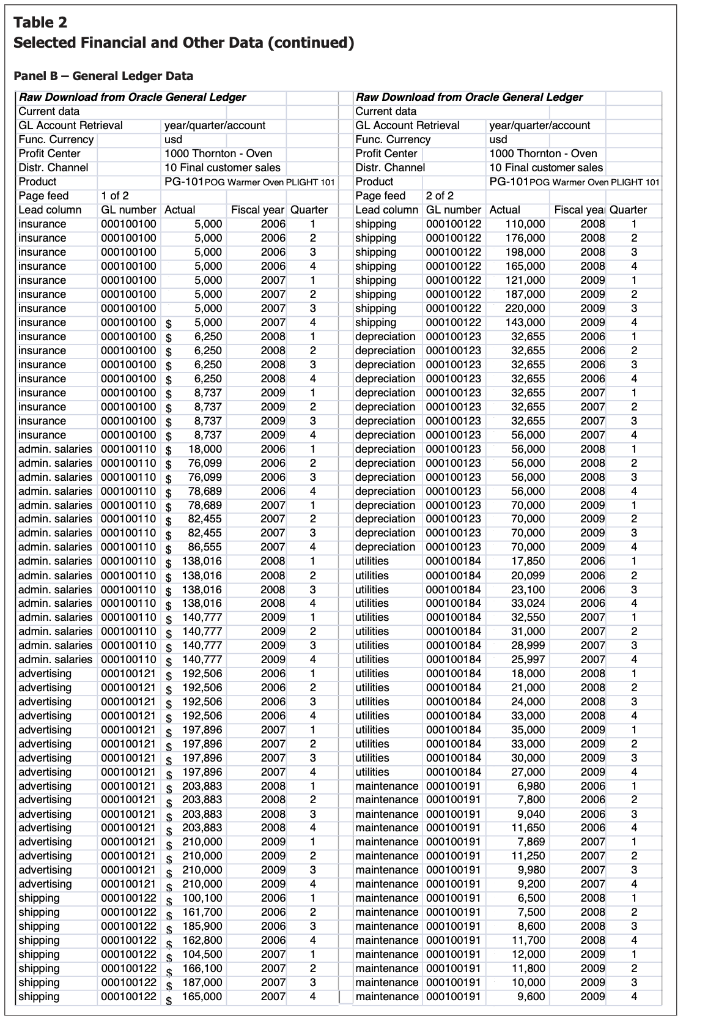
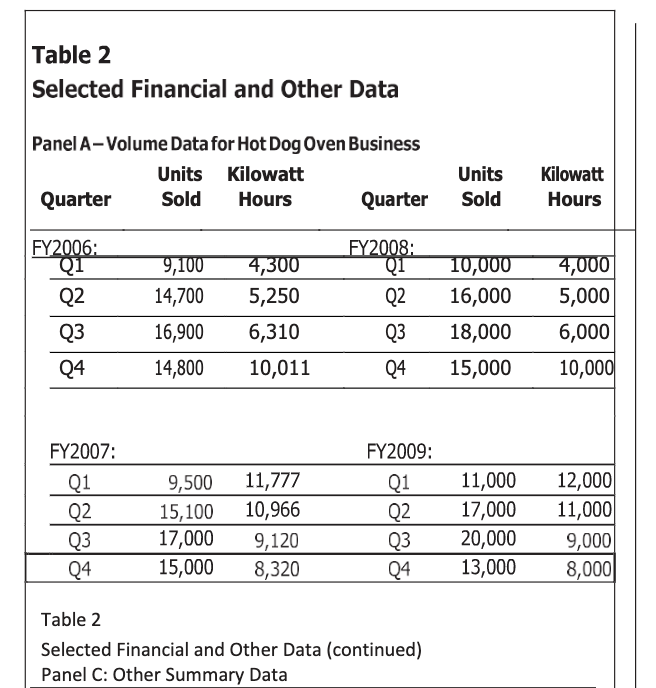
Complete the table similar to the following (use the information provided Table 2, Panels B and C):
Cost Item Cost Formula Cost Behavior Notes/Assumptions
COGS $35 per unit sold Variable Table 2, Panel C
Sales Commissions 6 % of sales Variable Table 2, Panel C
Insurance
Admin. Salaries
Advertising
Shipping
Depreciation
Utilities Mixed (Variable + Fix)
Maintenance Mixed (Variable + Fix)
Each cost will either be variable, fixed, or mixed. Any managerial or cost accounting book will have a chapter (or portion of a chapter) on "Cost Behavior" that will explain how to determine whether a cost is variable, fixed, or mixed.
Second Bullet Point
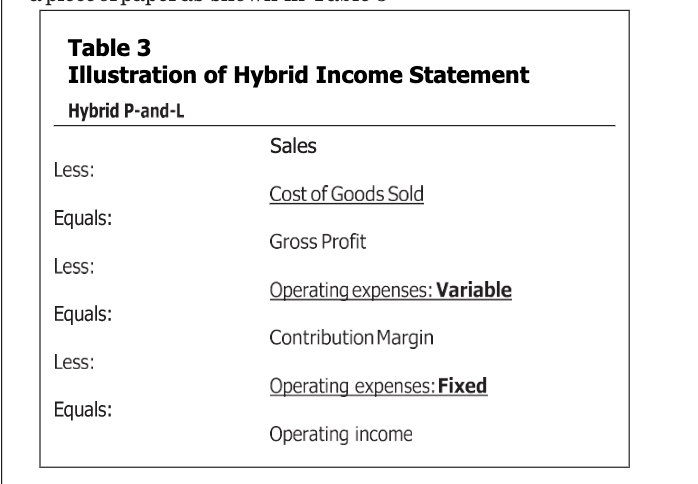
Use the information from the table above and the three scenarios listed at the bottom of Table 2, Panel C to create "hybrid" income statements like the one in Table 3.
Third Bullet Point
List pros (and cons) of the income statement format used above and discuss whether it will be useful for Storm.
Strategic Analysis - Future Expansion
This section actually includes two parts. Part (1) is not listed in the case:
Part (1)
You need to decide which of the three scenarios Storm should use: (1) base case, (2) market penetration strategy, or (3) market premium strategy. I used Excel for this.
(a) Use the information you entered in the table for the Financial Analysis (above) and calculate breakeven for the Base Strategy:
Breakeven = PX - VX - F
0 = (Price)(X) - (COGS/unit)(X) - [(Price)(X)](Commission Rate) - (Shipping/unit)(X) - (Utilities/KWH)(# of KWH) - (Mtce./KWH)(KWH) - Insurance - Adm. Salaries - Advertising - Depreciation - Fixed Portion of Utilities - Fixed Portion of Mtce.
P = price/unit
V = variable cost/unit (I listed each variable cost and each variable portion of mixed costs separately)
F = total fixed costs (I listed each fixed cost and each fixed portion of mixed costs separately)
X = number of units to breakeven
(b) After making adjustments for the information provided in the case, calculate breakeven for the Market Penetration Strategy and compare to the Base (1 above). Using this strategy, how many more (fewer) units would Storm have to sell to breakeven compared to the Base Strategy?
(c) Making adjustments for the information provided in the case, calculate breakeven for the Market Premium Strategy and compare to the Base (1 above). Using this strategy, how many more (fewer) units would Storm have to sell to breakeven compared to the Base Strategy?
(d) Based on this analysis, which strategy should Storm implement?
Again, a managerial or cost accounting book can help you with this. It would be listed under "Cost-Volume-Profit Analysis" (CVP).
Part (2)
Complete the task given in the case; that is, provide one strategy (activity) that Storm can implement to earn a profit during the off season (winter). Make sure to include all of the considerations listed (e.g., operating capital, personnel, etc.)
Strategic Analysis - Employing the C-framework - Use the C-framework to outline your advice to Storm about how to improve its strategic financial management function. Include a thorough discussion of the framework by linking each CFO-lever input to each of the three company-lever outputs.


Cost Formula $35 per unit sold 6% of sales Cost Behavior Variable Variable Notes/Assumptions Table 2, Panel C Table 2, Panel C Cost Item COGS Sales Commissions Insurance Admin. Salaries Advertising Shipping Depreciation Utilities Maintenance Mixed (Variable + Fix) Mixed (Variable + Fix) Table 1 Top Initiatives of Thornton Tornados Panel A-Game Day Events for All 1. Post-game fireworks and concert 2. Kids Happy Hour-free hour in FunZone for kids only 3. Surprise Major League visitor from the past 4. Meet-the-players night 5. Become a general manager for the weekend 6. Road trip give-away-travel with the team to a road game 7. Win a 1-hour shopping spree in the Tornados Shop 8. All-star kid of the game-one child selected before each game based upon pre-entry. 9. The Magical Family-one family selected to sit with team 10. Mascotencounter-sit with the "Tornados"team mascot Panel B-Special Request Game Day Experiences 1. Birthday party-food, swimming, FunZone games and special VIP treatment 2. Ceremonial first pitch-includes cap, autographed baseball, and team picture with you 3. Corporate outings and parties 4. Buy-a-box: Rentthe owners' box for a night for your event. Table 2 Selected Financial and Other Data (continued) shipping Panel B-General Ledger Data Raw Download from Oracle General Ledger Current data GL Account Retrieval year/quarter/account Func. Currency usd Profit Center 1000 Thornton - Oven Distr. Channel 10 Final customer sales Product PG-101 POG Warmer Oven PLIGHT 101 Page feed 1 of 2 Lead column GL number Actual Fiscal year Quarter insurance 000100100 5,000 2006 1 insurance 000100100 5,000 2006 2 insurance 000100100 5,000 2006 3 insurance 000100100 5,000 2006 4 insurance 000100100 5,000 2007 1 insurance 000100100 5,000 2007 2 insurance 000100100 5,000 2007 3 insurance 000100100 S 5,000 2007 4 insurance 000100100 $ 6,250 2008 1 1 insurance 000100100 $ 6.250 2008 2 insurance 000100100 $ 6,250 2008 3 insurance 000100100 $ 6,250 2008 4 Insurance 000100100 $ 8,737 2009 1 insurance 000100100 $ 8,737 2009 2 insurance 000100100 $ 8,737 2009 3 insurance 000100100 $ 8,737 2009 4 admin. salaries 000100110 $ 18,000 2006 1 admin. salaries 000100110 $ 76,099 2006 2 admin. salaries 000100110 $ 76,099 2006 3 admin, salaries 000100110 $ 78,689 2006 4 admin. salaries 000100110 $ 78,689 2007 1 admin. salaries 000100110 $ 82,455 2007 2 admin. salaries 000100110 $ 82,455 2007 3 admin. salaries 000100110 $ 86,555 2007 4 admin. salaries 000100110 $ 138,016 2008 1 admin. salaries 000100110 $ 138,016 2008 2 admin. salaries 000100110 $ 138,016 2008 3 admin. salaries 000100110 $ 138,016 2008 4 admin. salaries 000100110 S 140,777 2009 1 admin. salaries 000100110 s 140,777 2009 2 admin. salaries 000100110 140,777 2009 3 admin. salaries 000100110 140,777 2009 4 advertising 000100121 s 192,506 2006 1 advertising 000100121 $ 192,506 2006 2 advertising 000100121 s 192,506 2006 3 advertising 000100121 S 192,506 2006 4 advertising 000100121 s 197,896 2007 1 advertising 000100121 s 197,896 2007 2 advertising 000100121 S 197,896 2007 3 advertising 000100121 s 197,896 2007 4 advertising 000100121 s 203,883 2008 1 advertising 000100121 203,883 2008 2 advertising 000100121 2008 3 advertising 000100121 S 203,883 2008 4 advertising 000100121 $ 210,000 2009 1 advertising 000100121 210,000 2009 2 advertising 000100121 S 210,000 2009 3 advertising 000100121 S 210,000 2009 4 shipping 000100122 s 100,100 2006 1 shipping 000100122 S 161,700 2006 2 shipping 000100122185,900 2006 3 shipping 000100122 162,800 2006 4 shipping 000100122 $ 104,500 2007 1 1 shipping 000100122 S 166,100 2007 2 shipping 000100122 S 187,000 2007 3 shipping 000100122 165,000 2007 S 4 Raw Download from Oracle General Ledger Current data GL Account Retrieval year/quarter/account Func. Currency usd Profit Center 1000 Thornton - Oven Distr. Channel 10 Final customer sales Product PG-101 POG Warmer Oven PLIGHT 101 Page feed 2 of 2 Lead column GL number Actual Fiscal yea Quarter shipping 000100122 110,000 2008 1 shipping 000100122 176,000 2008 2 shipping 000100122 198,000 2008 3 shipping 000100122 165,000 2008 4 000100122 121,000 2009 1 1 shipping 000100122 187.000 2009 2 shipping 000100122 220,000 2009 3 shipping 000100122 143,000 2009 4 depreciation 000100123 32,655 2006 1 depreciation 000100123 32,655 2006 2 depreciation 000100123 32,655 2006 3 depreciation 000100123 32,655 2006 4 depreciation 000100123 32,655 2007 1 depreciation 000100123 32,655 2007 2 depreciation 000100123 32,655 2007 3 depreciation 000100123 56,000 2007 4 depreciation 000100123 56,000 2008 1 1 depreciation 000100123 56,000 2008 2 depreciation 000100123 56,000 2008 3 depreciation 000100123 56,000 2008 4 depreciation 000100123 70,000 2009 1 depreciation 000100123 70,000 2009 2 depreciation 000100123 70,000 2009 3 depreciation 000100123 70,000 2009 4 utilities 000100184 17,850 2006 1 utilities 000100184 20,099 2006 2 utilities 000100184 23,100 2006 3 utilities 000100184 33,024 2006 4 utilities 000100184 32,550 2007 1 utilities 000100184 31,000 2007 2 utilities 000100184 28,999 2007 3 utilities 000100184 25,997 2007 4 utilities 000100184 18,000 2008 1 utilities 000100184 21,000 2008 2 utilities 000100184 24,000 2008 3 utilities 000100184 33,000 2008 4 utilities 000100184 35,000 2009 1 utilities 000100184 33,000 2009 2 utilities 000100184 30,000 2009 3 utilities 000100184 27,000 2009 4 maintenance 000100191 6,980 2006 1 maintenance 000100191 7,800 2006 2 maintenance 000100191 9,040 2006 3 maintenance 000100191 11,650 2006 4 maintenance 000100191 7,869 2007 1 maintenance 000100191 11,250 2007 2 maintenance 000100191 9,980 2007 3 maintenance 000100191 9,200 2007 4 maintenance 000100191 6,500 2008 1 maintenance 000100191 7,500 2008 2 maintenance 000100191 8,600 2008 3 maintenance 000100191 11,700 2008 4 maintenance 000100191 12,000 2009 1 maintenance 000100191 11,800 2009 2 maintenance 000100191 10,000 2009 3 maintenance 000100191 9,600 2009 4 $ 203,883 Table 2 Selected Financial and Other Data Panel A-Volume Data for Hot Dog Oven Business Units Kilowatt Quarter Sold Hours Quarter Units Sold Kilowatt Hours FY2006: Q1 Q2 Q3 Q4 FY2008: Q1 Q2 9,100 14,700 16,900 4,300 5,250 6,310 10,011 10,000 16,000 18,000 15,000 4,000 5,000 6,000 10,000 Q3 14,800 Q4 FY2007: Q1 Q2 Q3 Q4 9,500 15,100 17,000 15,000 11,777 10,966 9,120 8,320 FY2009: Q1 Q2 Q3 Q4 11,000 17,000 20,000 13,000 12,000 11,000 9,000 8,000 Table 2 Selected Financial and Other Data (continued) Panel C: Other Summary Data Table 3 Illustration of Hybrid Income Statement Hybrid P-and-L Sales Less: Cost of Goods Sold Equals: Gross Profit Less: Operating expenses: Variable Equals: Contribution Margin Less: Operating expenses: Fixed Equals: Operating income Cost Formula $35 per unit sold 6% of sales Cost Behavior Variable Variable Notes/Assumptions Table 2, Panel C Table 2, Panel C Cost Item COGS Sales Commissions Insurance Admin. Salaries Advertising Shipping Depreciation Utilities Maintenance Mixed (Variable + Fix) Mixed (Variable + Fix) Table 1 Top Initiatives of Thornton Tornados Panel A-Game Day Events for All 1. Post-game fireworks and concert 2. Kids Happy Hour-free hour in FunZone for kids only 3. Surprise Major League visitor from the past 4. Meet-the-players night 5. Become a general manager for the weekend 6. Road trip give-away-travel with the team to a road game 7. Win a 1-hour shopping spree in the Tornados Shop 8. All-star kid of the game-one child selected before each game based upon pre-entry. 9. The Magical Family-one family selected to sit with team 10. Mascotencounter-sit with the "Tornados"team mascot Panel B-Special Request Game Day Experiences 1. Birthday party-food, swimming, FunZone games and special VIP treatment 2. Ceremonial first pitch-includes cap, autographed baseball, and team picture with you 3. Corporate outings and parties 4. Buy-a-box: Rentthe owners' box for a night for your event. Table 2 Selected Financial and Other Data (continued) shipping Panel B-General Ledger Data Raw Download from Oracle General Ledger Current data GL Account Retrieval year/quarter/account Func. Currency usd Profit Center 1000 Thornton - Oven Distr. Channel 10 Final customer sales Product PG-101 POG Warmer Oven PLIGHT 101 Page feed 1 of 2 Lead column GL number Actual Fiscal year Quarter insurance 000100100 5,000 2006 1 insurance 000100100 5,000 2006 2 insurance 000100100 5,000 2006 3 insurance 000100100 5,000 2006 4 insurance 000100100 5,000 2007 1 insurance 000100100 5,000 2007 2 insurance 000100100 5,000 2007 3 insurance 000100100 S 5,000 2007 4 insurance 000100100 $ 6,250 2008 1 1 insurance 000100100 $ 6.250 2008 2 insurance 000100100 $ 6,250 2008 3 insurance 000100100 $ 6,250 2008 4 Insurance 000100100 $ 8,737 2009 1 insurance 000100100 $ 8,737 2009 2 insurance 000100100 $ 8,737 2009 3 insurance 000100100 $ 8,737 2009 4 admin. salaries 000100110 $ 18,000 2006 1 admin. salaries 000100110 $ 76,099 2006 2 admin. salaries 000100110 $ 76,099 2006 3 admin, salaries 000100110 $ 78,689 2006 4 admin. salaries 000100110 $ 78,689 2007 1 admin. salaries 000100110 $ 82,455 2007 2 admin. salaries 000100110 $ 82,455 2007 3 admin. salaries 000100110 $ 86,555 2007 4 admin. salaries 000100110 $ 138,016 2008 1 admin. salaries 000100110 $ 138,016 2008 2 admin. salaries 000100110 $ 138,016 2008 3 admin. salaries 000100110 $ 138,016 2008 4 admin. salaries 000100110 S 140,777 2009 1 admin. salaries 000100110 s 140,777 2009 2 admin. salaries 000100110 140,777 2009 3 admin. salaries 000100110 140,777 2009 4 advertising 000100121 s 192,506 2006 1 advertising 000100121 $ 192,506 2006 2 advertising 000100121 s 192,506 2006 3 advertising 000100121 S 192,506 2006 4 advertising 000100121 s 197,896 2007 1 advertising 000100121 s 197,896 2007 2 advertising 000100121 S 197,896 2007 3 advertising 000100121 s 197,896 2007 4 advertising 000100121 s 203,883 2008 1 advertising 000100121 203,883 2008 2 advertising 000100121 2008 3 advertising 000100121 S 203,883 2008 4 advertising 000100121 $ 210,000 2009 1 advertising 000100121 210,000 2009 2 advertising 000100121 S 210,000 2009 3 advertising 000100121 S 210,000 2009 4 shipping 000100122 s 100,100 2006 1 shipping 000100122 S 161,700 2006 2 shipping 000100122185,900 2006 3 shipping 000100122 162,800 2006 4 shipping 000100122 $ 104,500 2007 1 1 shipping 000100122 S 166,100 2007 2 shipping 000100122 S 187,000 2007 3 shipping 000100122 165,000 2007 S 4 Raw Download from Oracle General Ledger Current data GL Account Retrieval year/quarter/account Func. Currency usd Profit Center 1000 Thornton - Oven Distr. Channel 10 Final customer sales Product PG-101 POG Warmer Oven PLIGHT 101 Page feed 2 of 2 Lead column GL number Actual Fiscal yea Quarter shipping 000100122 110,000 2008 1 shipping 000100122 176,000 2008 2 shipping 000100122 198,000 2008 3 shipping 000100122 165,000 2008 4 000100122 121,000 2009 1 1 shipping 000100122 187.000 2009 2 shipping 000100122 220,000 2009 3 shipping 000100122 143,000 2009 4 depreciation 000100123 32,655 2006 1 depreciation 000100123 32,655 2006 2 depreciation 000100123 32,655 2006 3 depreciation 000100123 32,655 2006 4 depreciation 000100123 32,655 2007 1 depreciation 000100123 32,655 2007 2 depreciation 000100123 32,655 2007 3 depreciation 000100123 56,000 2007 4 depreciation 000100123 56,000 2008 1 1 depreciation 000100123 56,000 2008 2 depreciation 000100123 56,000 2008 3 depreciation 000100123 56,000 2008 4 depreciation 000100123 70,000 2009 1 depreciation 000100123 70,000 2009 2 depreciation 000100123 70,000 2009 3 depreciation 000100123 70,000 2009 4 utilities 000100184 17,850 2006 1 utilities 000100184 20,099 2006 2 utilities 000100184 23,100 2006 3 utilities 000100184 33,024 2006 4 utilities 000100184 32,550 2007 1 utilities 000100184 31,000 2007 2 utilities 000100184 28,999 2007 3 utilities 000100184 25,997 2007 4 utilities 000100184 18,000 2008 1 utilities 000100184 21,000 2008 2 utilities 000100184 24,000 2008 3 utilities 000100184 33,000 2008 4 utilities 000100184 35,000 2009 1 utilities 000100184 33,000 2009 2 utilities 000100184 30,000 2009 3 utilities 000100184 27,000 2009 4 maintenance 000100191 6,980 2006 1 maintenance 000100191 7,800 2006 2 maintenance 000100191 9,040 2006 3 maintenance 000100191 11,650 2006 4 maintenance 000100191 7,869 2007 1 maintenance 000100191 11,250 2007 2 maintenance 000100191 9,980 2007 3 maintenance 000100191 9,200 2007 4 maintenance 000100191 6,500 2008 1 maintenance 000100191 7,500 2008 2 maintenance 000100191 8,600 2008 3 maintenance 000100191 11,700 2008 4 maintenance 000100191 12,000 2009 1 maintenance 000100191 11,800 2009 2 maintenance 000100191 10,000 2009 3 maintenance 000100191 9,600 2009 4 $ 203,883 Table 2 Selected Financial and Other Data Panel A-Volume Data for Hot Dog Oven Business Units Kilowatt Quarter Sold Hours Quarter Units Sold Kilowatt Hours FY2006: Q1 Q2 Q3 Q4 FY2008: Q1 Q2 9,100 14,700 16,900 4,300 5,250 6,310 10,011 10,000 16,000 18,000 15,000 4,000 5,000 6,000 10,000 Q3 14,800 Q4 FY2007: Q1 Q2 Q3 Q4 9,500 15,100 17,000 15,000 11,777 10,966 9,120 8,320 FY2009: Q1 Q2 Q3 Q4 11,000 17,000 20,000 13,000 12,000 11,000 9,000 8,000 Table 2 Selected Financial and Other Data (continued) Panel C: Other Summary Data Table 3 Illustration of Hybrid Income Statement Hybrid P-and-L Sales Less: Cost of Goods Sold Equals: Gross Profit Less: Operating expenses: Variable Equals: Contribution Margin Less: Operating expenses: Fixed Equals: Operating income
 Financial Analysis


