financial analysis of the case study, using the case study overview?
1. % growth rate from 2014 to 2019
2. Recommendations to buyer Great Lakes Partners LLP based on multiple of adjusted EBITDA for the last twevle months ende in September 2015
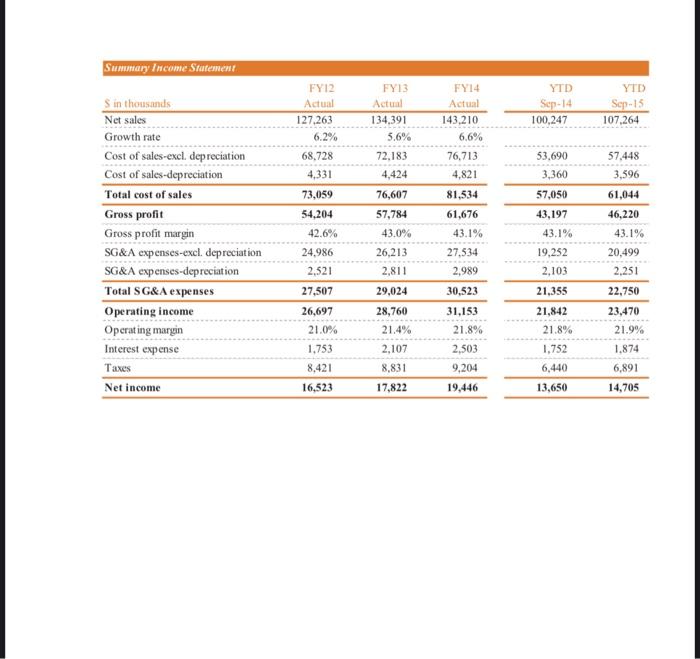
3. Calculate EBITDA form FY12-FY14
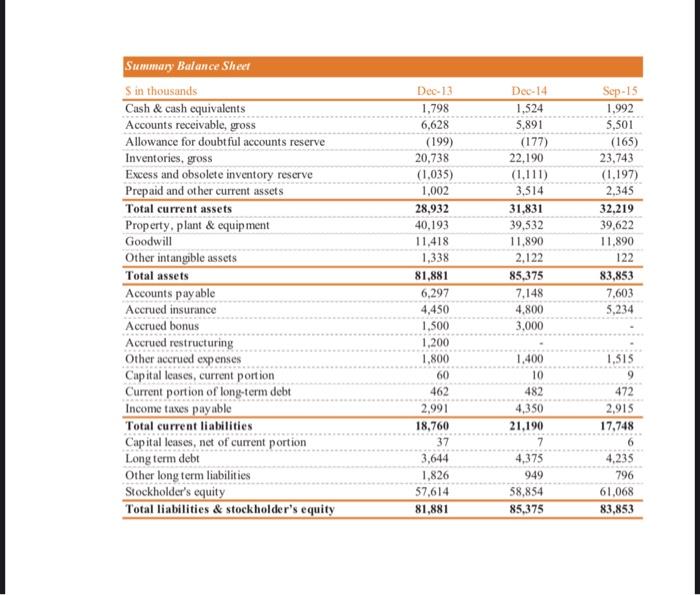
4. Debt to equity ratio
5. Calculator working capital
6. Calculate the quality of the earnings
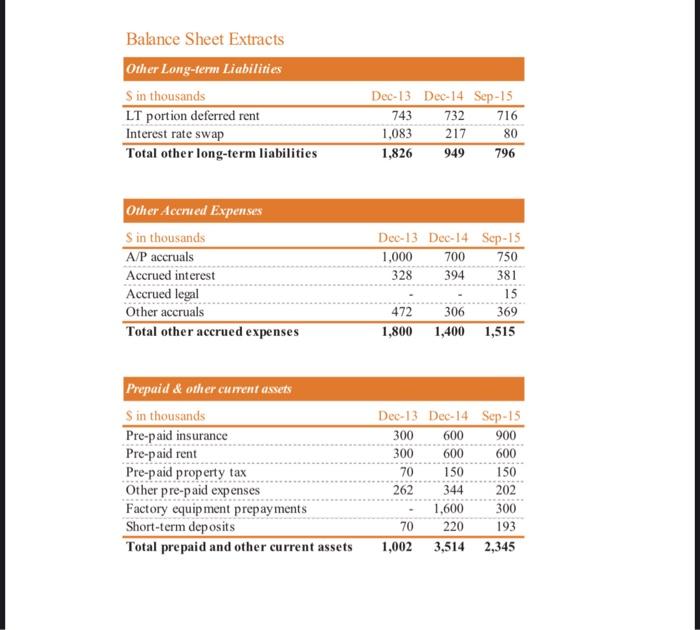
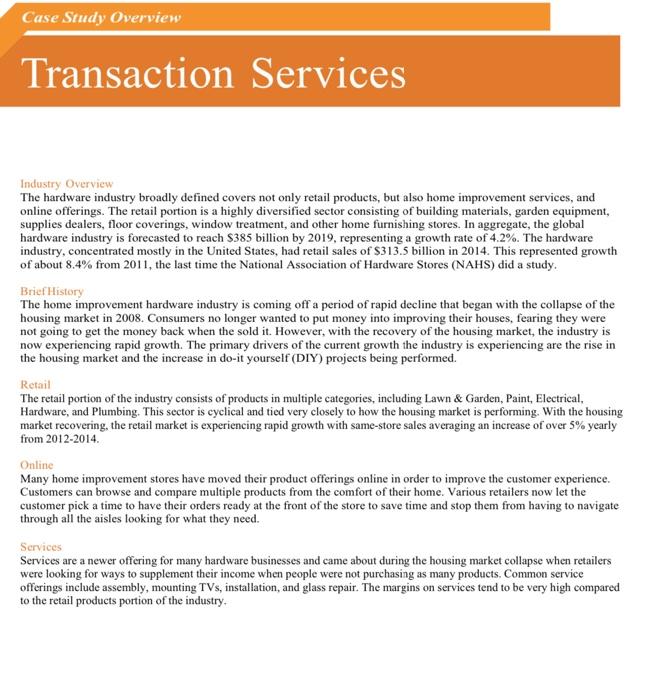
Case Study Overview Transaction Services Industry Overview The hardware industry broadly defined covers not only retail products, but also home improvement services, and online offerings. The retail portion is a highly diversified sector consisting of building materials, garden equipment, supplies dealers, floor coverings, window treatment, and other home furnishing stores. In aggregate, the global hardware industry is forecasted to reach $385 billion by 2019, representing a growth rate of 4.2%. The hardware industry, concentrated mostly in the United States, had retail sales of $313.5 billion in 2014. This represented growth of about 8.4% from 2011, the last time the National Association of Hardware Stores (NAHS) did a study. Brief History The home improvement hardware industry is coming off a period of rapid decline that began with the collapse of the housing market in 2008. Consumers no longer wanted to put money into improving their houses, fearing they were not going to get the money back when the sold it. However, with the recovery of the housing market, the industry is now experiencing rapid growth. The primary drivers of the current growth the industry is experiencing are the rise in the housing market and the increase in do-it yourself (DIY) projects being performed. Retail The retail portion of the industry consists of products in multiple categories, including Lawn & Garden, Paint, Electrical, Hardware, and Plumbing. This sector is cyclical and tied very closely to how the housing market is performing. With the housing market recovering the retail market is experiencing rapid growth with same-store sales averaging an increase of over 5% yearly from 2012-2014 Online Many home improvement stores have moved their product offerings online in order to improve the customer experience. Customers can browse and compare multiple products from the comfort of their home. Various retailers now let the customer pick a time to have their orders ready at the front of the store to save time and stop them from having to navigate through all the aisles looking for what they need. Services Services are a newer offering for many hardware businesses and came about during the housing market collapse when retailers were looking for ways to supplement their income when people were not purchasing as many products. Common service offerings include assembly, mounting TVs, installation, and glass repair. The margins on services tend to be very high compared to the retail products portion of the industry, Sales by product line FYI FY14 FY11 Actual 38,764 Sin thousands Hardware Plumbing % of sales mix Actu Paint FY10 Actu 36,785 34.294 30.975 28.8% 21.095 19.6% of sales mix Lawn and siden of sales mix Electrical S of sales mix Services % of sales mix Total sales Actual 42.986 33.8% 34,012 26.796 23.083 18.1% 14.917 11.796 12.265 32.497 28.794 22.149 19.6" 10.957 9.7% 8.864 7.8% 113.231 41,384 44,986 30.8% 35.335 35.578 2639 24.8% 24,052 24,978 179% 17.4% 18.143 20,672 13.5% 14.4 15,457 16,996 11.5% 11.99 134.391 143.210 10.435 YTD YTD Sep-14 Seps 31,490 34,544 31.4% 32.2% 24,905 27 231 24.8% 25.4% 17.485 17.845 17.49 16,6% 14.470 14.893 14:49 13.9% 11,897 12.751 11.99 11.9% 100.247 107.264 9.7 8,170 7.6% 107,460 127.263 Margin by product line YTD Sep-14 11.206 35.6% 11.922 FYTO Actu 13.004 35.4% 12.031 38.8% 6.561 31.194 5.904 56.6% 5,460 66.8% 42.960 FY11 Actu 13.983 36.1% 13.879 42.74 6,689 30.29 5.994 54.79 Sin thousands Hardware Plumbing % margin Paint margin Lawn and garden % margin Electrical % margin Services margin Total margin FY12 Actual 16,013 37.3% 15.873 46,7% 7234 31.3% 6,399 42.996 8.685 70.8% 54.204 FY14 Actual 16,009 35.6% 17.032 47.99 7.842 FYI Actual 15.532 37.5% 16,089 45.5 7.367 30.6% 7.332 41.5% 11.264 72.9% 57,784 $.489 YTD Sep15 11.990 34.794 12.757 46.8% 5.873 32.99 5,705 38.3% 9.895 77.6% 46.220 7,617 36.85 13.176 77.396 61.676 5.332 36.85 9,248 77.7% 43.197 70.6% 46,807 Depreciation-CoS by product line FY10 Sins thousands Actual Hardware Plumbing 1.520 Paint 1.111 Lawn and garden 757 Electrical 374 Services 93 Total de priciation 3.855 FY11 Actual 1.596 1.167 795 393 103 FY12 Actual 1.676 1.225 859 463 10% FY13 Actual 1.706 1.246 873 486 113 4.424 FY14 Actual 1.791 1.408 917 576 129 4.821 YTD Sep14 1.254 975 642 399 90 3.360 YTD Sp.15 1.342 1.043 687 427 97 3.596 4,054 4,331 Summary Income Statement YTD Sep-14 100,247 YTD Sep15 107,264 FY12 Actual 127.263 6.2% 68,728 4,331 FY13 Actual 134,391 5,6% 72.183 4,424 FY14 Actual 143.210 6,6% 76,713 4,821 81.534 61,676 43.1% 27.534 2,989 53,690 3,360 57,050 43,197 57,448 3,596 61,044 46,220 73,059 Sin thousands Net sales Growth rate Cost of sales-excl. depreciation Cost of sales-depreciation Total cost of sales Gross profit Gross profit margin SG&A expenses-excl. depreciation SG&A expenses-depreciation Total SG&A expenses Operating income Operating margin Interest expense Taxes Net income 43.1% 76,607 57,784 43.0% 26,213 2,811 54,204 42.6% 24,986 2,521 27,507 26,697 21.0% 43.1% 19.252 2,103 30,523 29,024 28,760 21.4% 2.107 8,831 31,153 21.8% 2,503 21,355 21,842 21.8% 1.752 6,440 20,499 2.251 22,750 23,470 21.9% 1,874 6,891 14,705 1,753 8,421 9,204 16,523 17,822 19.446 13,650 Summary Balance Sheer Sin thousands Cash & cash equivalents Accounts receivable, gross Allowance for doubtful accounts reserve Inventories, gross Excess and obsolete inventory reserve Prepaid and other current assets Total current assets Property, plant & equipment Goodwill Other intangible assets Total assets Accounts payable Accrued insurance Accrued bonus Accrued restructuring Other accrued expenses Capital leases, current portion Current portion of long-term debt Income taxes payable Total current liabilities Capital leases, net of current portion Long term debt Other long term liabilities Stockholder's equity Total liabilities & stockholder's equity Dec-13 1,798 6,628 (199) 20,738 (1,035) 1,002 28,932 40,193 11.418 1,338 81.881 6,297 4,450 1,500 1.200 1,800 60 462 2,991 18,760 37 3,644 1,826 57,614 81,881 Dec-14 1,524 5,891 (177) 22,190 (1,111) 3,514 31,831 39,532 11.890 2,122 85,375 7.148 4.800 3,000 Sep-15 1.992 5,501 (165) 23,743 (1.197) 2,345 32,219 39,622 11.890 122 83,853 7,603 5,234 1,515 1.400 10 482 4,350 21,190 472 2,915 17,748 4,375 949 58,854 85,375 4,235 796 61,068 83,853 Summary Balance Sheer Sin thousands Cash & cash equivalents Accounts receivable, gross Allowance for doubtful accounts reserve Inventories, gross Excess and obsolete inventory reserve Prepaid and other current assets Total current assets Property, plant & equipment Goodwill Other intangible assets Total assets Accounts payable Accrued insurance Accrued bonus Accrued restructuring Other accrued expenses Capital leases, current portion Current portion of long-term debt Income taxes payable Total current liabilities Capital leases, net of current portion Long term debt Other long term liabilities Stockholder's equity Total liabilities & stockholder's equity Dec-13 1,798 6,628 (199) 20,738 (1,035) 1,002 28,932 40,193 11.418 1,338 81.881 6,297 4,450 1,500 1.200 1,800 60 462 2,991 18,760 37 3,644 1,826 57,614 81,881 Dec-14 1,524 5,891 (177) 22,190 (1,111) 3,514 31,831 39,532 11.890 2,122 85,375 7.148 4.800 3,000 Sep-15 1.992 5,501 (165) 23,743 (1.197) 2,345 32,219 39,622 11.890 122 83,853 7,603 5,234 1,515 1.400 10 482 4,350 21,190 472 2,915 17,748 4,375 949 58,854 85,375 4,235 796 61,068 83,853 Balance Sheet Extracts Other Long-term Liabilities Sin thousands LT portion deferred rent Interest rate swap Total other long-term liabilities Dec-13 Dec-14 Sep-15 743 732 716 1,083 217 80 1,826 949 796 Other Accrued Expenses Sin thousands A/P accruals Accrued interest Accrued legal Other accruals Total other accrued expenses Dec-13 Dec-14 Sep-15 1,000 700 750 328 394 381 15 472 306 369 1,800 1,400 1,515 Prepaid & other current assets Sin thousands Pre-paid insurance Pre-paid rent Pre-paid property tax Other pre-paid expenses Factory equipment prepayments Short-term deposits Total prepaid and other current assets Dec-13 Dec-14 Sep-15 300 600 900 300 600 600 70 150 150 262 344 202 1,600 300 70 220 193 1,002 3,514 2,345 Case Study Overview Transaction Services Industry Overview The hardware industry broadly defined covers not only retail products, but also home improvement services, and online offerings. The retail portion is a highly diversified sector consisting of building materials, garden equipment, supplies dealers, floor coverings, window treatment, and other home furnishing stores. In aggregate, the global hardware industry is forecasted to reach $385 billion by 2019, representing a growth rate of 4.2%. The hardware industry, concentrated mostly in the United States, had retail sales of $313.5 billion in 2014. This represented growth of about 8.4% from 2011, the last time the National Association of Hardware Stores (NAHS) did a study. Brief History The home improvement hardware industry is coming off a period of rapid decline that began with the collapse of the housing market in 2008. Consumers no longer wanted to put money into improving their houses, fearing they were not going to get the money back when the sold it. However, with the recovery of the housing market, the industry is now experiencing rapid growth. The primary drivers of the current growth the industry is experiencing are the rise in the housing market and the increase in do-it yourself (DIY) projects being performed. Retail The retail portion of the industry consists of products in multiple categories, including Lawn & Garden, Paint, Electrical, Hardware, and Plumbing. This sector is cyclical and tied very closely to how the housing market is performing. With the housing market recovering the retail market is experiencing rapid growth with same-store sales averaging an increase of over 5% yearly from 2012-2014 Online Many home improvement stores have moved their product offerings online in order to improve the customer experience. Customers can browse and compare multiple products from the comfort of their home. Various retailers now let the customer pick a time to have their orders ready at the front of the store to save time and stop them from having to navigate through all the aisles looking for what they need. Services Services are a newer offering for many hardware businesses and came about during the housing market collapse when retailers were looking for ways to supplement their income when people were not purchasing as many products. Common service offerings include assembly, mounting TVs, installation, and glass repair. The margins on services tend to be very high compared to the retail products portion of the industry, Sales by product line FYI FY14 FY11 Actual 38,764 Sin thousands Hardware Plumbing % of sales mix Actu Paint FY10 Actu 36,785 34.294 30.975 28.8% 21.095 19.6% of sales mix Lawn and siden of sales mix Electrical S of sales mix Services % of sales mix Total sales Actual 42.986 33.8% 34,012 26.796 23.083 18.1% 14.917 11.796 12.265 32.497 28.794 22.149 19.6" 10.957 9.7% 8.864 7.8% 113.231 41,384 44,986 30.8% 35.335 35.578 2639 24.8% 24,052 24,978 179% 17.4% 18.143 20,672 13.5% 14.4 15,457 16,996 11.5% 11.99 134.391 143.210 10.435 YTD YTD Sep-14 Seps 31,490 34,544 31.4% 32.2% 24,905 27 231 24.8% 25.4% 17.485 17.845 17.49 16,6% 14.470 14.893 14:49 13.9% 11,897 12.751 11.99 11.9% 100.247 107.264 9.7 8,170 7.6% 107,460 127.263 Margin by product line YTD Sep-14 11.206 35.6% 11.922 FYTO Actu 13.004 35.4% 12.031 38.8% 6.561 31.194 5.904 56.6% 5,460 66.8% 42.960 FY11 Actu 13.983 36.1% 13.879 42.74 6,689 30.29 5.994 54.79 Sin thousands Hardware Plumbing % margin Paint margin Lawn and garden % margin Electrical % margin Services margin Total margin FY12 Actual 16,013 37.3% 15.873 46,7% 7234 31.3% 6,399 42.996 8.685 70.8% 54.204 FY14 Actual 16,009 35.6% 17.032 47.99 7.842 FYI Actual 15.532 37.5% 16,089 45.5 7.367 30.6% 7.332 41.5% 11.264 72.9% 57,784 $.489 YTD Sep15 11.990 34.794 12.757 46.8% 5.873 32.99 5,705 38.3% 9.895 77.6% 46.220 7,617 36.85 13.176 77.396 61.676 5.332 36.85 9,248 77.7% 43.197 70.6% 46,807 Depreciation-CoS by product line FY10 Sins thousands Actual Hardware Plumbing 1.520 Paint 1.111 Lawn and garden 757 Electrical 374 Services 93 Total de priciation 3.855 FY11 Actual 1.596 1.167 795 393 103 FY12 Actual 1.676 1.225 859 463 10% FY13 Actual 1.706 1.246 873 486 113 4.424 FY14 Actual 1.791 1.408 917 576 129 4.821 YTD Sep14 1.254 975 642 399 90 3.360 YTD Sp.15 1.342 1.043 687 427 97 3.596 4,054 4,331 Summary Income Statement YTD Sep-14 100,247 YTD Sep15 107,264 FY12 Actual 127.263 6.2% 68,728 4,331 FY13 Actual 134,391 5,6% 72.183 4,424 FY14 Actual 143.210 6,6% 76,713 4,821 81.534 61,676 43.1% 27.534 2,989 53,690 3,360 57,050 43,197 57,448 3,596 61,044 46,220 73,059 Sin thousands Net sales Growth rate Cost of sales-excl. depreciation Cost of sales-depreciation Total cost of sales Gross profit Gross profit margin SG&A expenses-excl. depreciation SG&A expenses-depreciation Total SG&A expenses Operating income Operating margin Interest expense Taxes Net income 43.1% 76,607 57,784 43.0% 26,213 2,811 54,204 42.6% 24,986 2,521 27,507 26,697 21.0% 43.1% 19.252 2,103 30,523 29,024 28,760 21.4% 2.107 8,831 31,153 21.8% 2,503 21,355 21,842 21.8% 1.752 6,440 20,499 2.251 22,750 23,470 21.9% 1,874 6,891 14,705 1,753 8,421 9,204 16,523 17,822 19.446 13,650 Summary Balance Sheer Sin thousands Cash & cash equivalents Accounts receivable, gross Allowance for doubtful accounts reserve Inventories, gross Excess and obsolete inventory reserve Prepaid and other current assets Total current assets Property, plant & equipment Goodwill Other intangible assets Total assets Accounts payable Accrued insurance Accrued bonus Accrued restructuring Other accrued expenses Capital leases, current portion Current portion of long-term debt Income taxes payable Total current liabilities Capital leases, net of current portion Long term debt Other long term liabilities Stockholder's equity Total liabilities & stockholder's equity Dec-13 1,798 6,628 (199) 20,738 (1,035) 1,002 28,932 40,193 11.418 1,338 81.881 6,297 4,450 1,500 1.200 1,800 60 462 2,991 18,760 37 3,644 1,826 57,614 81,881 Dec-14 1,524 5,891 (177) 22,190 (1,111) 3,514 31,831 39,532 11.890 2,122 85,375 7.148 4.800 3,000 Sep-15 1.992 5,501 (165) 23,743 (1.197) 2,345 32,219 39,622 11.890 122 83,853 7,603 5,234 1,515 1.400 10 482 4,350 21,190 472 2,915 17,748 4,375 949 58,854 85,375 4,235 796 61,068 83,853 Summary Balance Sheer Sin thousands Cash & cash equivalents Accounts receivable, gross Allowance for doubtful accounts reserve Inventories, gross Excess and obsolete inventory reserve Prepaid and other current assets Total current assets Property, plant & equipment Goodwill Other intangible assets Total assets Accounts payable Accrued insurance Accrued bonus Accrued restructuring Other accrued expenses Capital leases, current portion Current portion of long-term debt Income taxes payable Total current liabilities Capital leases, net of current portion Long term debt Other long term liabilities Stockholder's equity Total liabilities & stockholder's equity Dec-13 1,798 6,628 (199) 20,738 (1,035) 1,002 28,932 40,193 11.418 1,338 81.881 6,297 4,450 1,500 1.200 1,800 60 462 2,991 18,760 37 3,644 1,826 57,614 81,881 Dec-14 1,524 5,891 (177) 22,190 (1,111) 3,514 31,831 39,532 11.890 2,122 85,375 7.148 4.800 3,000 Sep-15 1.992 5,501 (165) 23,743 (1.197) 2,345 32,219 39,622 11.890 122 83,853 7,603 5,234 1,515 1.400 10 482 4,350 21,190 472 2,915 17,748 4,375 949 58,854 85,375 4,235 796 61,068 83,853 Balance Sheet Extracts Other Long-term Liabilities Sin thousands LT portion deferred rent Interest rate swap Total other long-term liabilities Dec-13 Dec-14 Sep-15 743 732 716 1,083 217 80 1,826 949 796 Other Accrued Expenses Sin thousands A/P accruals Accrued interest Accrued legal Other accruals Total other accrued expenses Dec-13 Dec-14 Sep-15 1,000 700 750 328 394 381 15 472 306 369 1,800 1,400 1,515 Prepaid & other current assets Sin thousands Pre-paid insurance Pre-paid rent Pre-paid property tax Other pre-paid expenses Factory equipment prepayments Short-term deposits Total prepaid and other current assets Dec-13 Dec-14 Sep-15 300 600 900 300 600 600 70 150 150 262 344 202 1,600 300 70 220 193 1,002 3,514 2,345