

Answered step by step
Verified Expert Solution
Question
1 Approved Answer
FINANCIAL ANALYSIS ratio example you can use this formulas and compare between 2 companies in the same sector upload Excel sheet and a PowerPoint presentation
FINANCIAL ANALYSIS ratio
example
you can use this formulas and compare between 2 companies in the same sector
upload Excel sheet and a PowerPoint presentation
compare between two companies
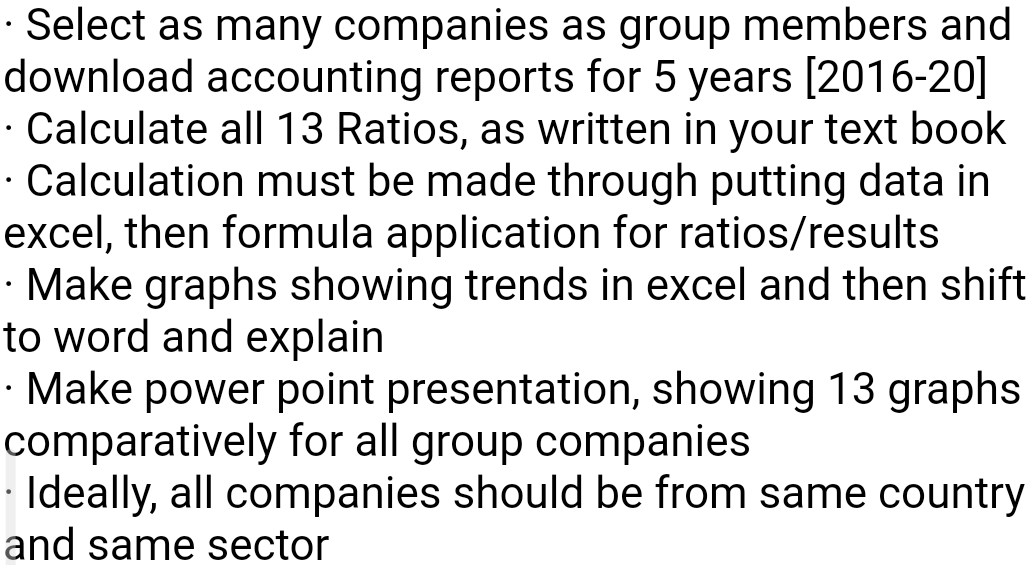
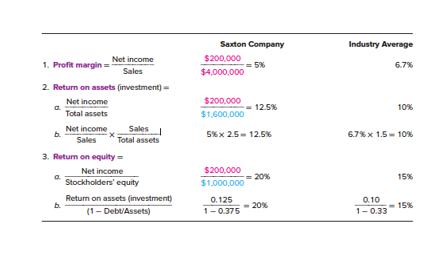
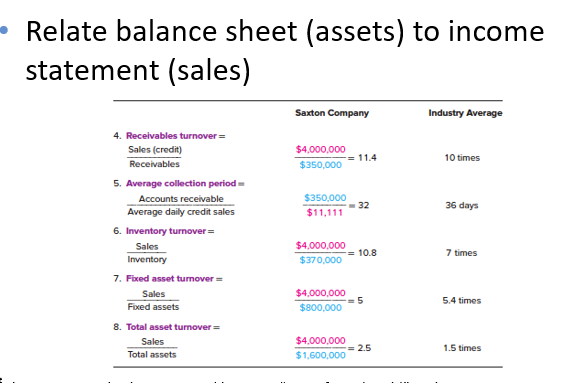
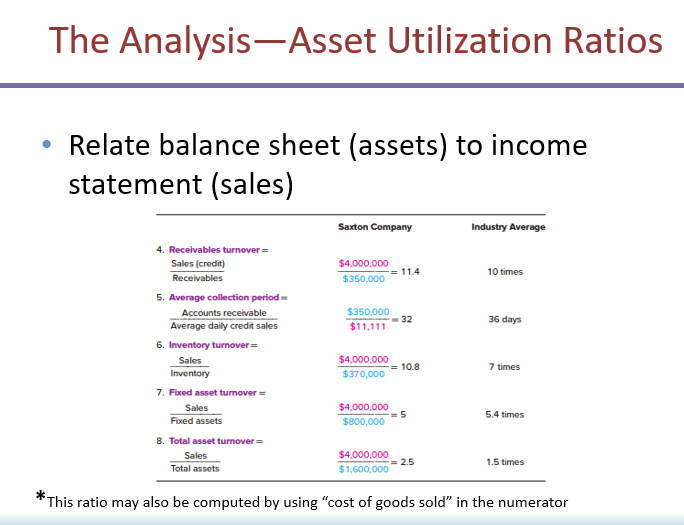
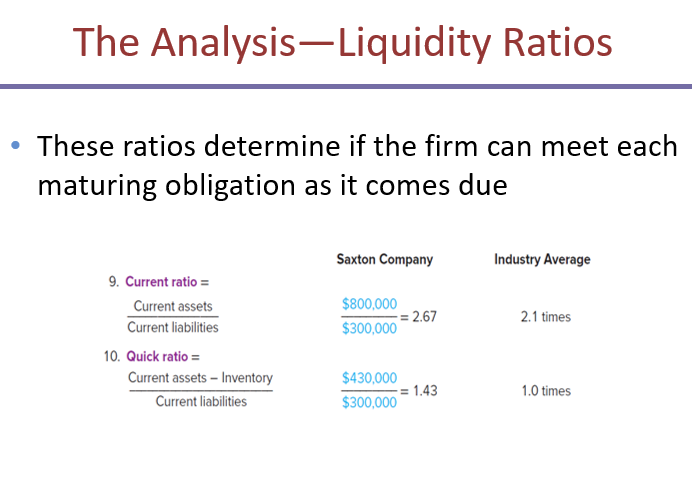
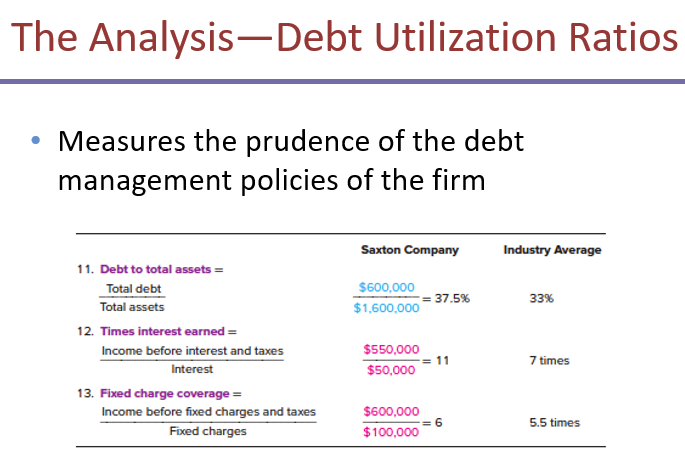
Select as many companies as group members and download accounting reports for 5 years [2016-20] Calculate all 13 Ratios, as written in your text book Calculation must be made through putting data in excel, then formula application for ratios/results Make graphs showing trends in excel and then shift to word and explain Make power point presentation, showing 13 graphs comparatively for all group companies Ideally, all companies should be from same country and same sector Industry Average Saxton Company $200,000 $4,000,000 6.7% $200,000 $1,600,000 12.5% 10% Net income 1. Profit margin= Sales 2. Return on assets (investment) - Not income c Total assets Net income b. Sales Sales Total assets 3. Return on equity Net income a Stockholders' equity Return on assets investment) b. (1 - Debu/Assets) 5%x 25 -12.5% 6.7%x 1.5 - 10% 15% $200,000 20% $1,000,000 0.125 1 -0.375 20% 0.10 1 -0.33 15% Relate balance sheet (assets) to income statement (sales) Saxton Company Industry Average $4,000,000 $350,000 11.4 10 times $350,000 $11,111 32 36 days 4. Receivables turnover = Sales (credit) Receivables 5. Average collection period Accounts receivable Average daily credit sales 6. Inventory turnover = Sales Inventory 7. Fixed asset turnover = Sales Fixed assets $4,000,000 = 10.8 $370.000 7 times $4,000,000 $800,000 5 5.4 times 8. Total asset turnover = Sales Total assets $4,000,000 = 2.5 $1,600,000 1.5 times The Analysis-Asset Utilization Ratios Relate balance sheet (assets) to income statement (sales) Saxton Company Industry Average $4,000,000 = 11.4 $350,000 10 times $350,000 $11,111 32 36 days 4. Receivables turnover = Sales (credit) Receivables 5. Average collection period Accounts receivable Average daily credit sales 6. Inventory turnover Sales Inventory 7. Fixed asset turnover = Sales Fixed assets 8. Total asset turnover = Sales Total assets $4,000,000 = 10.8 $370,000 7 times $4,000,000 $800,000 5.4 times $4,000,000 $1,600,000 2.5 1.5 times * This ratio may also be computed by using "cost of goods sold" in the numerator The Analysis-Liquidity Ratios These ratios determine if the firm can meet each maturing obligation as it comes due Saxton Company Industry Average $800,000 = 2.67 $300,000 2.1 times 9. Current ratio = Current assets Current liabilities 10. Quick ratio = Current assets - Inventory Current liabilities $430,000 = 1.43 $300,000 1.0 times The Analysis-Debt Utilization Ratios Measures the prudence of the debt management policies of the firm Saxton Company Industry Average $600,000 $1,600,000 37.5% 33% 11. Debt to total assets = Total debt Total assets 12. Times interest earned = Income before interest and taxes Interest 13. Fixed charge coverage = Income before fixed charges and taxes Fixed charges $550,000 $50,000 11 7 times $600,000 $100,000 5.5 times Select as many companies as group members and download accounting reports for 5 years [2016-20] Calculate all 13 Ratios, as written in your text book Calculation must be made through putting data in excel, then formula application for ratios/results Make graphs showing trends in excel and then shift to word and explain Make power point presentation, showing 13 graphs comparatively for all group companies Ideally, all companies should be from same country and same sector Industry Average Saxton Company $200,000 $4,000,000 6.7% $200,000 $1,600,000 12.5% 10% Net income 1. Profit margin= Sales 2. Return on assets (investment) - Not income c Total assets Net income b. Sales Sales Total assets 3. Return on equity Net income a Stockholders' equity Return on assets investment) b. (1 - Debu/Assets) 5%x 25 -12.5% 6.7%x 1.5 - 10% 15% $200,000 20% $1,000,000 0.125 1 -0.375 20% 0.10 1 -0.33 15% Relate balance sheet (assets) to income statement (sales) Saxton Company Industry Average $4,000,000 $350,000 11.4 10 times $350,000 $11,111 32 36 days 4. Receivables turnover = Sales (credit) Receivables 5. Average collection period Accounts receivable Average daily credit sales 6. Inventory turnover = Sales Inventory 7. Fixed asset turnover = Sales Fixed assets $4,000,000 = 10.8 $370.000 7 times $4,000,000 $800,000 5 5.4 times 8. Total asset turnover = Sales Total assets $4,000,000 = 2.5 $1,600,000 1.5 times The Analysis-Asset Utilization Ratios Relate balance sheet (assets) to income statement (sales) Saxton Company Industry Average $4,000,000 = 11.4 $350,000 10 times $350,000 $11,111 32 36 days 4. Receivables turnover = Sales (credit) Receivables 5. Average collection period Accounts receivable Average daily credit sales 6. Inventory turnover Sales Inventory 7. Fixed asset turnover = Sales Fixed assets 8. Total asset turnover = Sales Total assets $4,000,000 = 10.8 $370,000 7 times $4,000,000 $800,000 5.4 times $4,000,000 $1,600,000 2.5 1.5 times * This ratio may also be computed by using "cost of goods sold" in the numerator The Analysis-Liquidity Ratios These ratios determine if the firm can meet each maturing obligation as it comes due Saxton Company Industry Average $800,000 = 2.67 $300,000 2.1 times 9. Current ratio = Current assets Current liabilities 10. Quick ratio = Current assets - Inventory Current liabilities $430,000 = 1.43 $300,000 1.0 times The Analysis-Debt Utilization Ratios Measures the prudence of the debt management policies of the firm Saxton Company Industry Average $600,000 $1,600,000 37.5% 33% 11. Debt to total assets = Total debt Total assets 12. Times interest earned = Income before interest and taxes Interest 13. Fixed charge coverage = Income before fixed charges and taxes Fixed charges $550,000 $50,000 11 7 times $600,000 $100,000 5.5 timesStep by Step Solution
There are 3 Steps involved in it
Step: 1

Get Instant Access to Expert-Tailored Solutions
See step-by-step solutions with expert insights and AI powered tools for academic success
Step: 2

Step: 3
Ace Your Homework with AI
Get the answers you need in no time with our AI-driven, step-by-step assistance
Get Started
Leveraged Buyouts Plus Website A Practical Guide To Investment Banking And Private Equity
Authors: Paul Pignataro
1st Edition
1118674545, 978-1118674543