

Question
Financial characteristics of companies vary for many reasons. The two most prominent drivers are industry economics and firm strategy. Each industry has a financial norm
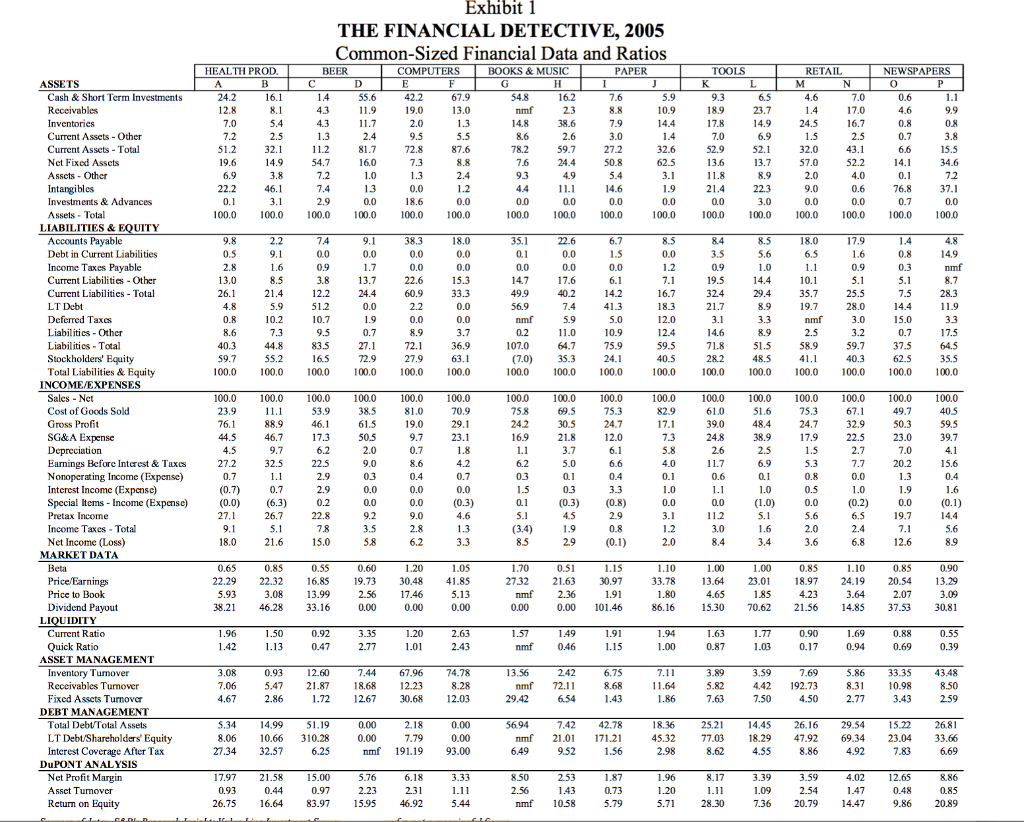
Financial characteristics of companies vary for many reasons. The two most prominent drivers are industry economics and firm strategy. Each industry has a financial norm around which companies within the industry tend to operate. An airline, for example, would naturally be expected to have a high proportion of fixed assets (airplanes), while a consulting firm would not. A steel manufacturer would be expected to have a lower gross margin than a pharmaceutical manufacturer because commodities such as steel are subject to strong price competition, while highly differentiated products like patented drugs enjoy much more pricing freedom. Because of unique economic features of each industry, average financial statements will vary from one industry to the next. Similarly, companies within industries have different financial characteristics, in part, because of the diverse strategies that can be employed. Executives choose strategies that will position their company favorably in the competitive jockeying within an industry. Strategies typically entail making important choices in how a product is made (e.g., capital intensive versus labor intensive), how it is marketed (e.g., direct sales versus the use of distributors), and how the company is financed (e.g., the use of debt or equity). Strategies among companies in the same industry can differ dramatically. Different strategies can produce striking differences in financial results for firms in the same industry. The following paragraphs describe pairs of participants in a number of different industries. Their strategies and market niches provide clues as to the financial condition and performance that one would expect of them. The companies common-sized financial statements and operating data, as of early 2005, are presented in a standardized format in Exhibit 1. It is up to you to match the financial data with the company descriptions. Also, try to explain the differences in financial results across industries.
Health Products
Companies A and B manufacture and market health-care products. One firm is the worlds largest prescription-pharmaceutical company. This firm has a very broad and deep pipeline of ethical pharmaceuticals, supported by a robust research and development budget. In recent years, the company has divested several of its nonpharmaceutical businesses, and it has come to be seen as the partner of choice for licensing deals with other pharmaceutical and biotechnology firms.
The other company is a diversified health-products company that manufactures and mass markets a broad line of prescription pharmaceuticals, over-the-counter remedies (i.e., nonprescription drugs), consumer health and beauty products, and medical diagnostics and devices. For its consumer segment, brand development and management are a major element of this firms mass-market-oriented strategy.
Computers
Companies E and F sell computers and related equipment. One company focuses exclusively on mail-order sales of built-to-order PCs, including desktops, laptops, notebooks, servers, workstations, printers, and handheld devices. The company is an assembler of PC components manufactured by its suppliers. The company allows its customers to design, price, and purchase through its Web site.
The other company sells a highly differentiable line of computers, consumer-oriented electronic devices, and a variety of proprietary software products. Led by its charismatic founder, the company has begun to recover from a dramatic decline in its market share. The firm has an aggressive retail strategy intended to drive traffic through its stores and to expand its installed base of customers by showcasing its products in a user-friendly retail atmosphere.
Question
Identify the companies ( What companies) in the two industries to which you are assigned and briefly discuss:
Discuss how the companies identified differ in significant ways from each other within the industry.
Exhibit 1 THE FINANCIAL DETECTIVE, 2005 Common-Sized Financial Data and Ratios HEALTH PROD. COMPUTERS BOOKS &MUSIC PAPER TOOLS RETAIL NEWSPAPERS ASSETS 0 Cash & Short Term Investments Current Assets Other Current Asscts Total Nct Fixed Asscts 5.5 782 26 7,9 10,9 625 $2.9 6,9 24,5 17,0 0,6 13.6 22,2 3.8 54,7 8.7-9,5 '.3 0.0 Assets Total 00.0 100.0 100.0 100.0 100.0 100.0 000 100.0 100.0 100.0 100.0 00.0 100.0 100,0 100.0 100.0 LIABILITIES &EQUITY Accounts Payable Debt in Current Liabilities Income Taxes Payable Current Liabilities Other Current Liabilitics Total LT Debt 324 35.7 569 4026.1 Liabilitics Total Stockholders' Equity Total Liabilities & Equity 1000 353 75.9 00.0 100.0 100.0 58.9 40.3 35.5 100.0 00.0 100.0 100,0 100.0 100,0 100.0 100.0 100.0 100.0 100.0 100.0 100.0 INCOME/EXPENSES 100.0 100.0 100.0 100.0 1000 Sales Net Cost of Goods Sold Gross Profit SG&A Expense 00.0 100.0 100.0 100.0 100.0 100.0 100.0 100.0 100.0 100.0 100.0 06 69 s 22.s 03 40s 0 397 0.0 (1.00.0(0.2 .0(0.1) 32.9 169 30s 7s3 73 39 51.6 32.5 Earnings Before Interest& Taxes Nonoperating Income (Expense) Interest Income (E Special Items Income ( Pretax Income Income Taxes Total Net Income (Loss) 6.6 0.0 (0.3) (0.8) 9.2 0.8 58 284.6 MARKET DATA 1.00 0.90 18.97 24.19 20.54 13.29 19.73 30.48 41.85 17.46 22.29 22.3216.85 27.32 21.63 30.97 Price/Earnings Price to Book Dividend Payout nmf 2.36 0.00 101.46 38.2 46.28 33.16 86.16 5.30 70.62 21.56 14.85 37.53 3081 Current Ratio 0.88 Ratio nmf 0.46 0.87 0.69 ASSET MANAGEMENT Turnover 0.93 12.60 5.47 21.87 18 7.44 67.96 74.78 18.68 12.23 13.56 5.86 33.35 43.48 4.42 192.73 Reccivables Turnover Fixed Assets Turnover nmf 72.11 29.42 1.72 2.67 30.68 2.03 DEBT MANAGEMENT 25.21 7.42 42.78 nmf 21.01 171.21 9.52 1.56 14.4526.16 29.54 5.22 2681 7.03 8.29 47.92 69.34 23.04 33.66 694 Total Debt Total Assets LT Debt/Shareholders Equity Interest Coverage After Tax 8.0610.66 310.28 nmf 191.19 93.00 27.34 32.57 17.9721.58 15.00 26.75 6.64 8397 15.95 46.92 DuPONT ANALYSIS 3.33 3.59 12.65 Asset Tunover nmf 1058 5.71 28.30 7.36 20.79 14.47Step by Step Solution
There are 3 Steps involved in it
Step: 1

Get Instant Access to Expert-Tailored Solutions
See step-by-step solutions with expert insights and AI powered tools for academic success
Step: 2

Step: 3
Ace Your Homework with AI
Get the answers you need in no time with our AI-driven, step-by-step assistance
Get Started
Credit Derivatives Handbook Global Perspectives Innovations And Market Drivers
Authors: Greg Gregoriou, Paul Ali
1st Edition
0071549528, 978-0071549523