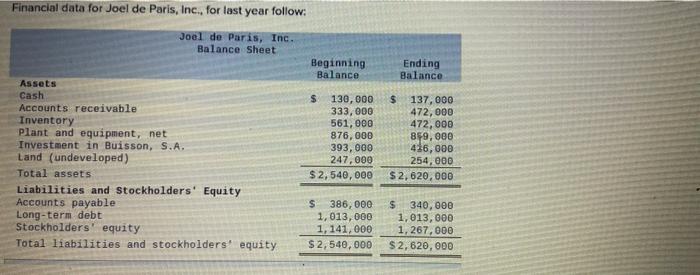
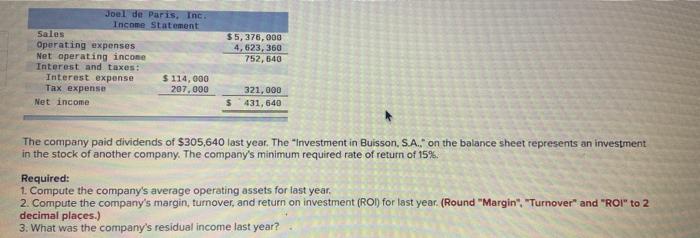
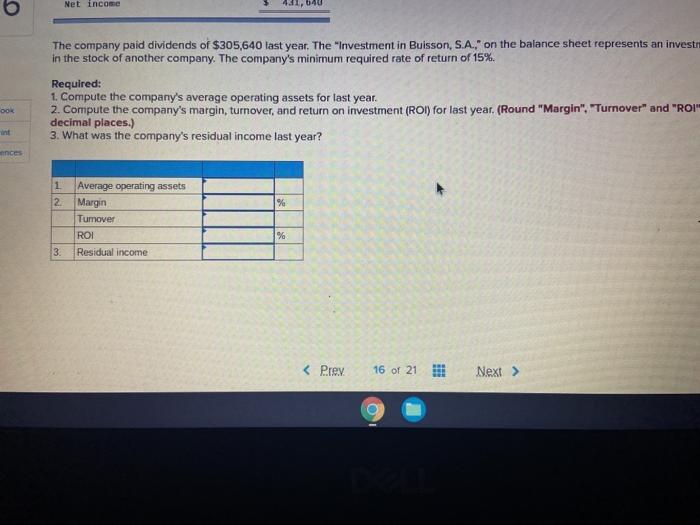
Financial data for Joel de Paris, Inc., for last year follow: Joel de Paris, Inc. Balance Sheet Beginning Balance Ending Balance Assets Cash Accounts receivable Inventory plant and equipment, net Investment in Buisson, S.A. Land (undeveloped) Total assets Liabilities and Stockholders' Equity Accounts payable Long-term debt Stockholders' equity Total liabilities and stockholders' equity $ 130,000 333,000 561, 000 876,000 393, 000 247,000 $ 2,540,000 $ 137,000 472,000 472,000 8$9,000 416,000 254,000 $2,620,000 $ 386,000 1,013,000 1,141,000 $ 2,540,000 s 340,000 1.013,000 1, 267,000 $ 2,620,000 Joel de Paris, Inc. Income Statement Sales Operating expenses Net operating income Interest and taxes: Interest expense $ 114,000 Tax expense 207.000 Net income $5,376,000 4,623, 360 752, 640 321,000 431, 640 The company paid dividends of $305,640 last year. The "Investment in Buisson, S.A." on the balance sheet represents an investment in the stock of another company. The company's minimum required rate of return of 15%. Required: 1. Compute the company's average operating assets for last year, 2. Compute the company's margin, turnover, and return on investment (ROfor last year. (Round "Margin", "Turnover" and "ROI" to 2 decimal places.) 3. What was the company's residual income last year? Net incase 4361,040 The company paid dividends of $305,640 last year. The "Investment in Buisson, S.A." on the balance sheet represents an invest in the stock of another company. The company's minimum required rate of return of 15%. Required: 1. Compute the company's average operating assets for last year. 2. Compute the company's margin, turnover, and return on investment (ROI) for last year. (Round "Margin", "Turnover" and "ROI decimal places.) 3. What was the company's residual income last year? OOK ces 1 2 % Average operating assets Margin Tumover ROI Residual income % 3.