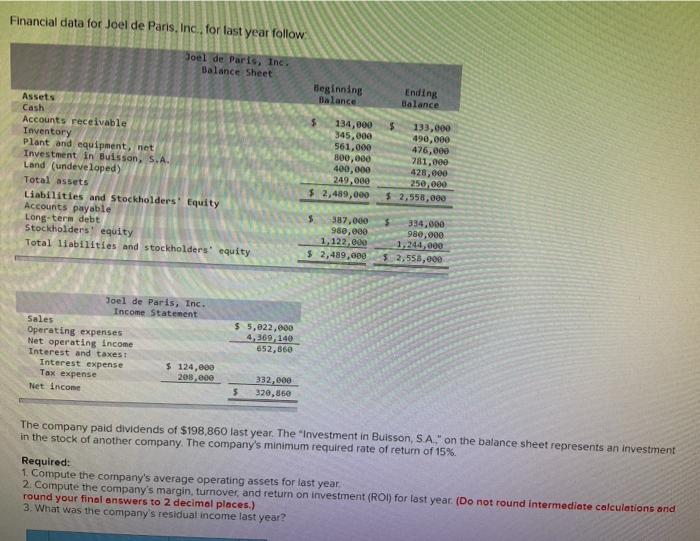
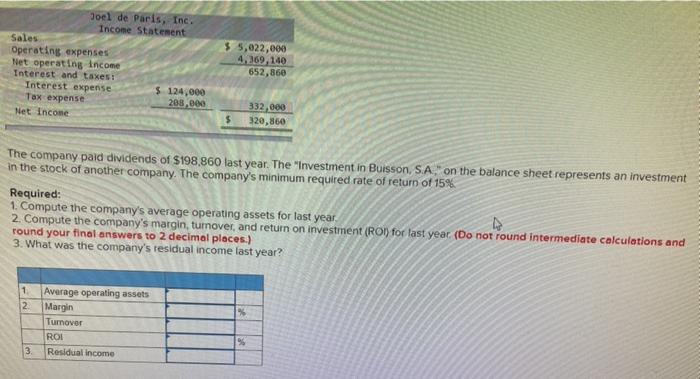
Financial data for Joel de Paris, Inc. for last year follow Joel de Paris, Inc. Balance Sheet Beginning Balance Ending Balance Assets Cash Accounts receivable Inventory Plant and equipment, net Investment in Buisson, S.A. Land (undeveloped Total assets Liabilities and Stockholders' Equity Accounts payable Long-term debt Stockholders' equity Total liabilities and stockholdersequity 134,000 345,000 561.000 800,000 400,000 249,000 $ 2,489,000 $ 133,000 490,000 476,000 781,000 428,000 250,000 $ 2,558,000 387,000 980,000 1,122, $ 2,489,000 334.000 980,000 1.244,000 52,558,000 Joel de Paris, Inc. Income Statement Sales Operating expenses Net operating Income Interest and taxes Interest expense $ 124,000 Tax expense 208,000 Net Income $ 5,022,000 4,369 140 652,860 5 332,000 320,860 The company paid dividends of $198,860 last year. The "Investment in Buisson, SA." on the balance sheet represents an investment in the stock of another company. The company's minimum required rate of return of 15%. Required: 1 Compute the company's average operating assets for last year 2. Compute the company's margin, turnover, and return on investment (ROI) for last year. (Do not round intermediate calculations and round your final answers to 2 decimal places.) 3. What was the company's residual income last year? Joel de Paris, Inc. Income Statement Sales Operating expenses Net operating Income Interest and taxes: Interest expense $ 124,000 Tax expense 205,000 Net Income $ 5,022,000 4.369, 140 652,860 5 332,000 320,860 The company paid dividends of S198,860 last year. The "Investment in Buisson, S.A. on the balance sheet represents an investment in the stock of another company. The company's minimum required rate of return of 15% Required: 1. Compute the company's average operating assets for last year, 2. Compute the company's margin, tumover, and return on investment (ROI) for last year (Do not found intermediate calculations and round your final answers to 2 decimal places) 3. What was the company's residual income last year? 1 2 % Average operating assets Margin Tumover ROL Residual income 9 3