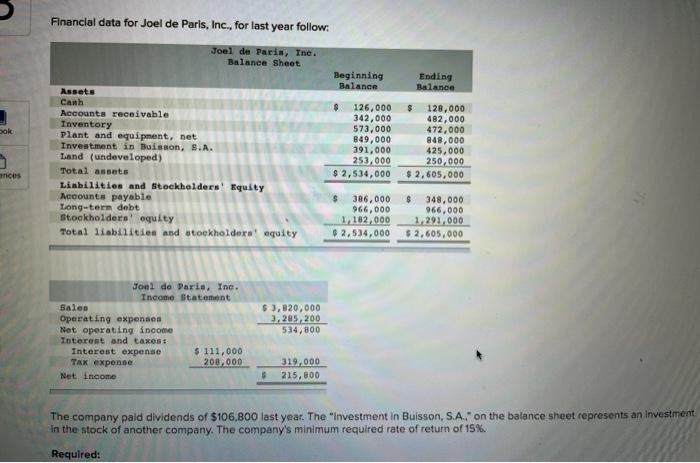
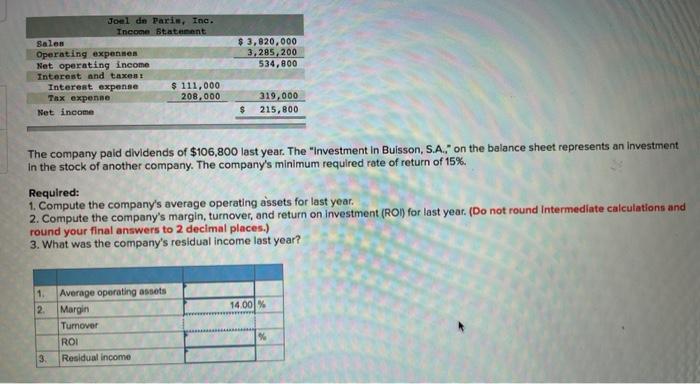
Financial data for Joel de Paris, Inc., for last year follow: Joel de Paris, Ine. Balance Sheet Beginning Balance Ending Balance bok Assets Canh Accounts receivable Inventory Plant and equipment, net Investment in Buisson, S.A. Land (undeveloped) Total assets Liabilities and Stockholders' Equity Accounts payable Long-term debt Stockholders' equity Total liabilities and stockholders equity $ 126,000 342,000 573,000 849,000 391,000 253,000 $ 2,534,000 $ 128,000 482,000 472,000 848,000 425,000 250,000 $ 2,605,000 ces $ 386,000 966,000 1, 182,000 $ 2,534,000 $ 348,000 966,000 1,291,000 $ 2,605,000 Joel de Paris, Inc. Income Statement Sales Operating expenses Net operating income Interest and taxes Interest expense $ 111,000 Tax expense 200,000 Net Income $ 3,820,000 3,285,200 534,800 319,000 $ 215,800 The company paid dividends of $106,800 last year. The "Investment in Buisson, S.A. on the balance sheet represents an investment in the stock of another company. The company's minimum required rate of return of 15%. Required: Joel de Paris, Inc. Income Statement Sales Operating expennen Net operating income Interest and taxes Interest expense $ 111,000 Tax expense 208,000 Net income $ 3,620,000 3,285,200 534,800 319,000 215,800 $ The company paid dividends of $106,800 last year. The "Investment in Buisson, S.A." on the balance sheet represents an investment In the stock of another company. The company's minimum required rate of return of 15%. Required: 1. Compute the company's average operating assets for last year. 2. Compute the company's margin, turnover, and return on investment (ROI) for last year. (Do not round Intermediate calculations and round your final answers to 2 decimal places.) 3. What was the company's residual income last year? 1 2 14.001% Average operating assets Margin Tumover ROI Residual income % 3