

Question
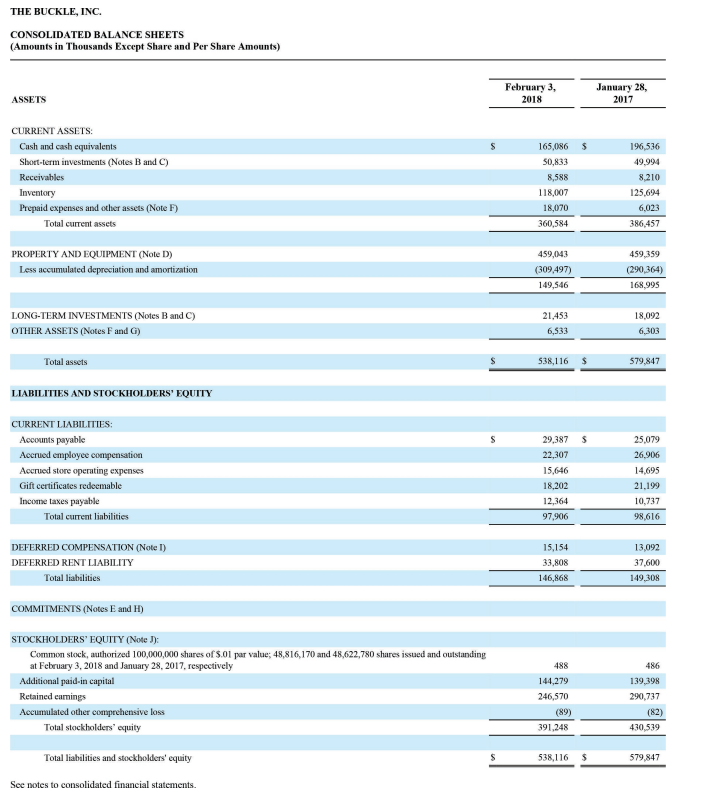
Financial information for American Eagle is presented in Apppendix A at the end of the book, and financial information for Buckle is presented in Appendix
Financial information for American Eagle is presented in Apppendix A at the end of the book, and financial information for Buckle is presented in Appendix B at the end of the book. The stock prices as of February 3, 2018 for American Eagle and Buckle were $17.56 and $19.60 respectively.
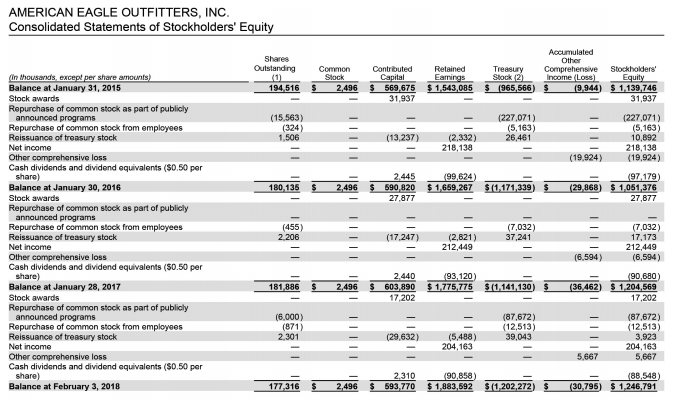
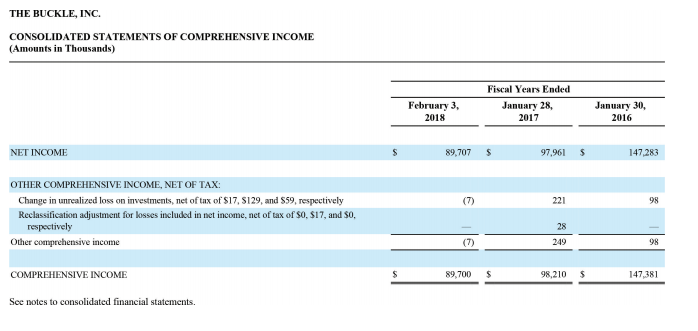
1a- Calculate the return on equity for American Eagle and Buckle for the year ended February 3, 2019
2a- Calculate the dividend yield for American Eagle and Buckle for the year ended February 3, 2018
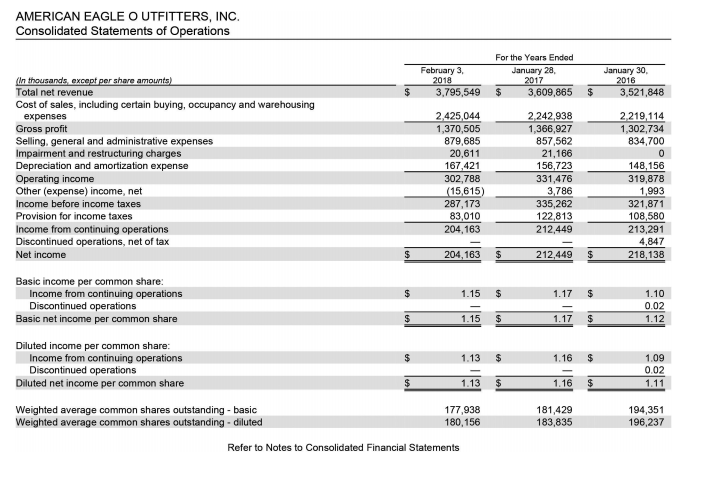
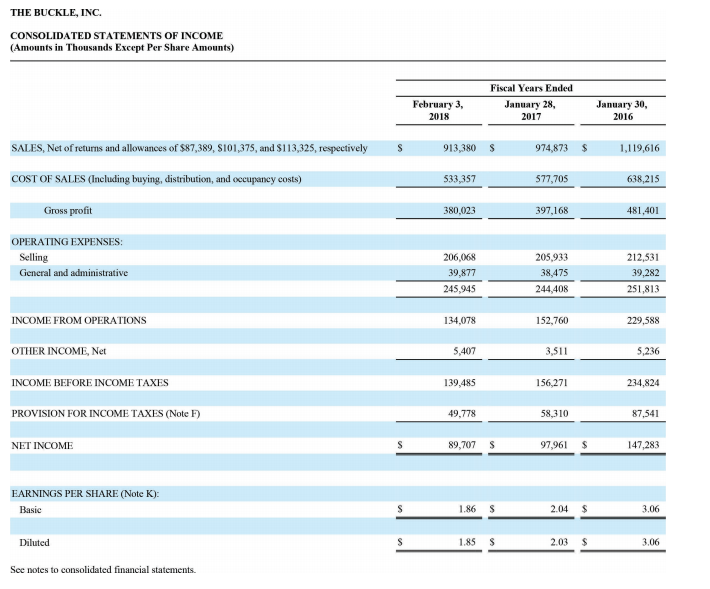
3a- Calculate the price-earnings ratio on February 3, 2018 for American Eagle and Buckle. Basic earnings per share are provided for each company near the bottom of the income statement.
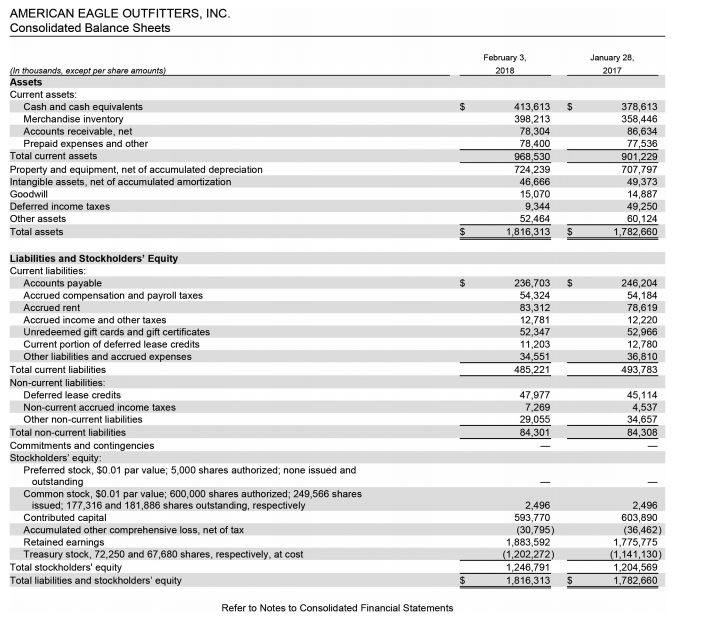
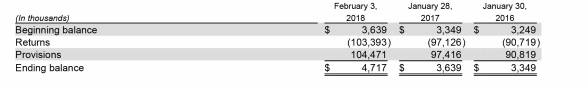
AMERICAN EAGLE OUTFITTERS, INC Consolidated Balance Sheets February 3, January 28, r shere Current assets 378,613 358,446 86,634 77,536 901,229 707,797 49,373 14,887 49,250 60,124 1,782,660 Cash and cash equivalents 413,613 $ Merchandise inventory 398,213 78,304 78,400 968,530 724,239 46,666 15,070 9,344 52464 Accounts receivable, net Prepaid expenses and other Total current assets Property and equipment, net of accumulated depreciation Intangible assets, net of accumulated amortization Deferred income taxes Other assets Total assets 1,816,313 S Liabilities and Stockholders' Equity Current liabilities 236,703 $ Accounts payable Accrued compensation and payroll taxes Accrued rent Accrued income and other taxes Unredeemed gift cards and gift certificates Current portion of deferred lease credits Other liabilities and accrued expenses 246,204 54,324 83,312 2,781 52,347 11,203 34,551 485,221 78,619 12,220 52,966 12,780 36,810 493,783 Total current liabilities 47,977 7,269 Deferred lease credits Non-current accrued income taxes Other non-current liabilities 34,657 84,308 Total non-current liabilities Commitments and contingencies 84,301 Preferred stock, $0.01 par value 5,000 shares authorized; none issued and outstanding Common stock, $0.01 par value; 600,000 shares authorized; 249,566 shares issued; 177,316 and 181,886 shares outstanding, respectively Contributed capital Accumulated other comprehensive loss, net of tax Retained earnings Treasury stock, 72,250 and 67,680 shares, respectively, at cost 2,496 603,890 (36,462) 1,775,775 2,496 593,770 (30,795) 1,883,592 1,202,272)(1,141,130) 1816,3131204.569 1,782,660 Total stockholders' equity Total liabilities and stockholders' equity 1,246,791 Refer to Notes to Consolidated Financial Statements AMERICAN EAGLE O UTFITTERS, INC. Consolidated Statements of Operations For the Years Ended January 28, Fobruary 3, January 30, Total net revenue Cost of sales, including certain buying, occupancy and warehousing $3,795,549 $ 3,609,865 3,521,848 2,219,114 1,302,734 834,700 2242,938 1,366,927 857,562 21,166 156,723 331,476 3,786 335,262 122,813 212,449 2,425,044 1,370,505 879,685 20,611 167,421 302,788 15,615) 287,173 expenses Gross profit Selling, general and administrative expenses Impairment and restructuring charges Depreciation and amortization expense Operating income Other (expense) income, net Income before income taxes Provision for income taxes Income from continuing operations Discontinued operations, net of tax Net income 148,156 319,878 1,993 321,871 108,580 213,291 4,847 218,138 204,163 204,163 $ 212,449 $ Basic income per common share 1.15 $ Income from continuing operations Discontinued operations 1.17 $ 0.02 1.12 1.15 $ Basic net income per common share 1.17 $ Diluted income per common share 1.13 $ Income from continuing operations Discontinued operations 0.02 1.11 Diluted net income per common share 1.13 1.16 Weighted average common shares outstanding basic Weighted average common shares outstanding - diluted 177,938 180,156 181,429 183,835 194,351 196,237 Refer to Notes to Consolidated Financial Statements AMERICAN EAGLE OUTFITTERS, INC. Consolidated Statements of Stockholders' Equity Shares Outstanding Common Contributed Retained Treasury housards Balance at January 31, 2015 Stock awards Repurchase of common stock as part of publicly 194,516 $ 2,496 $ 569,675 $ 1,543,085 $(965,566) $ (9.944 $1,139,746 31,937 31,937 (15,563) 324) 1,506 (227,071) (227,071) announced programs Repurchase of common stock from employees Reissuance of treasury stock Net income Other comprohensive loss Cash dividends and dividend equivalents ($0.50 per (5,163) 10,892 218,138 (19,924)(19,924) (2,332) 218,138 (13,237) 26.461 share) Balance at January 30, 2016 Stock awards Repurchase of common stock as part of publicly 180.135 2496 590.820 27,877 1659,267 1,171,339) i -(29,868) 1051,376 27,877 (7,032) 37,241 Repurchase of common stock from employees Reissuance of treasury stock Net income Other comprehensive loss Cash dividends and dividend equivalents (50.50 per 455) 2,206 (7,032) 17,173 (17.247) (2,821) 212,449 212,449 (6,594) (6,594) 2.440 (90,680) hare) Balance at January 28, 2017 Stock awards Repurchase of common stock as part of publicly 181,886 2496 603,890 $1775,775 $1.141.130) (36 462) 1204,569 17,202 17,202 (6.000) (87,672) (12,513) 39,043 (87,672) (12,513) 3,923 204,163 5,667 announced programs Repurchase of common stock from employees Reissuance of treasury stock Net income Other comprehensive loss Cash dividends and dividend equivalents ($0.50 per 2,301 (29,632) (5,488) 204,163 5,667 share) Balance at February 3, 2018 177316 $ 2,496 $593,770 1,883,692 $(1,202,272) $ (30,795) $1246791 AMERICAN EAGLE OUTFITTERS, INC Consolidated Statements of Cash Flows For the Years Ended February 3, Jaruary 28, January 30 Operating activities: Net income Gain from discontinued operations, net of tax ncome from continuing operations Adjustments to reconcile net income to net cash provided by operating 204,163 212449 S 213,291 204,163 $ 212449 S 58,174 29,137 14,838 (835) 20,576 169,473 16,890 44,312 (5,616) Depreciation and amortization Share based compensation Deferred income taxes Foroign currancy transaction (gain) loss Loss on impairment of assets Gain on sale of assets 148,858 34,977 4,680 2,977 (9,422) Changes in assets and liabilities (35,912)(53,613)(22,259) (7.705) Merchandise inventory 8,837 10,093) (7,027) 399) Prepaid expenses and other Other assets Accounts payable (6,705) 52.347 4.465 (5.229) (25,809) (10.695) 10,017) (16,663) (3,189) Unredemed gift cards and git certfiates Deferred lease credits Accrued compensation and payrol taxes Accrued income and other taxes Accrued liabilities Total adjustments 1,289 565 34,234 (17,615) Net cash provided by operating activities from continuing operations Investing activitics: 394,426 341,918 161.494) Capital expenditures for property and equipment Acquisitions and purchase of long-lived assets in business combination Proceeds from sale of assets Acquisition of intangible assets 169,469) (153,256) (10,442) Net cash used for investing activities from continuing operations Financing activitios: 172,150 163,022 (3,384 (87,682) (12,513) 3,355 7,635) Payments on capital leases and ather Repurchase of common stack as part of publicly announced programs Repurchase of common stack from employees Net proceeds from stock options exercised Excess tax benefit from share-based payments Cash dividends paid (4.375) (227,071) (7.032) 16.260 763 7,283 657 548) Net cash used for financing activities from continuing operations Effect of exchange rates on cash Cash flows of discontinued operations 85,064) 188,772 (6.805) Net cash used for operating activities Net cash used for investing activities Net cash used for financing activities Effect of exchange rates on cash Net cash used for discontinued operations Net increase (decrease) in cash and cash equivalents Cash and cash equivalents-beginning of period Cash and cash equivalents-end af period 6,805) 150,630) 260,087 118,546 067 5,000 Refer to Notes to Consolidated Financial Statements January 28, 2017 January 30 2016 February 3, 2018 in thousands) Beginning balance Returns 3,249 90,719) 90,819 3,349 3,639 S (103,393) 104,471 3,349 $ (97,126) 97,416 roisions Ending balance 4,717 S 3,639 $ THE BUCKLE, INC CONSOLIDATED BALANCE SHEETS (Amounts in Thousands Except Share and Per Share Amounts) February 3, 2018 January 28, 2017 ASSETS CURRET ASSETS 196,536 49,994 8,210 125,694 6.023 386.457 Cush and cash equivalents Shoet-term investments (Notes B and C) 165,086 5 50,833 8,588 118,007 18,070 360,584 Prepaid expenses and other assets (Note F) Total curent assets 459,043 (309,497) 149,546 PROPERTY AND EQUIPMENT (Note D) 459,359 (290,364) 168,995 LONG-TERM INVESTMENTS (Notes B and C) OTHER ASSETS (Notes F and G) 21,453 18,092 6,533 6.303 538,116 $ Total assets 579,847 LIABILITIES AND STOCKHOLDERS' EQUITY 29,387S 22,307 5,646 18,202 12,364 97,906 25,079 26,906 14,695 21,199 0,737 98,616 Accounts payable Accrued employce compensation Accrued store operating expenses Gift certificates redeemable Income taxes payable Total current liabilities 15,154 33,808 146,868 13,092 37,600 149.308 DEFERRED COMPENSATION (Note I) DEFERRED RENT LIABILITY Total liabilities COMMITMENTS (Notes E and H) STOCKHOLDERS EQUITY (Note J) Common stock, authorized 100,000,000 shares of S.01 par value: 48,816,170 and 48,622,780 shares issued and outstanding at February 3, 2018 and January 28, 2017, respectively 488 144,279 246,570 (89) 391,248 486 139,398 290,737 Additional paid-in capital Retained eamings Total stockholders equity 430,539 Total liabilities and stockholders' equity 538,116 579,847 See notes to consolidated financial statements THE BUCKLE, INC CONSOLIDATED STATEMENTS OF INCOME (Amounts in Thousands Except Per Share Amounts) Fiscal Years Ended February 3, 2018 January 28, 2017 January 30, 2016 SALES, Net of returns and allowances of $87,389, S101,375, and $113,325, respectively S 913,380 S 974,873$ 1,119,616 638,215 COST OF SALES (Including buying, distribution, and occupancy costs) 533,357 577,705 Gross profit 380,023 397,168 481,401 OPERATING EXPENSES Selling General and administrative 206,068 39,877 245,945 205,933 38,475 244,408 212,531 39,282 251,813 152,760 229,588 INCOME FROM OPERATIONS 134,078 OTHER INCOME, Net 5,407 3,511 5,236 INCOME BEFORE INCOME TAXES 139,485 156,271 234,824 PROVISION FOR INCOME TAXES (Note F) 49,778 58,310 87,541 89,707 S 97,96$ 147,283 NET INCOME EARNINGS PER SHARE (Note K) 3.06 1.86 S 2.04 Basic 1.85 S 2.03 S Diluted 3,06 See notes to consolidated financial statements THE BUCKLE, INC CONSOLIDATED STATEMENTS OF COMPREHENSIVE INCOME (Amounts in Thousands) Fiscal Years Ended February 3, 2018 January 28, 2017 January 30, 2016 97,961 S NET INCOME 89,707 $ 147,283 OTHER COMPREHENSIVE INCOME, NET OF TAX: Change in unrealized loss on investments, net of tax of S17, S129, and S59, respectively Reclassification adjustment for losses included in net income, net of tax of $0, $17, and $O, 221 98 respectively Other comprehensive income 28 249 98 COMPREHENSIVE INCOME 89,700 $ 98,210 $ 147,381 See notes to consolidated financial statements
Step by Step Solution
There are 3 Steps involved in it
Step: 1

Get Instant Access to Expert-Tailored Solutions
See step-by-step solutions with expert insights and AI powered tools for academic success
Step: 2

Step: 3
Ace Your Homework with AI
Get the answers you need in no time with our AI-driven, step-by-step assistance
Get Started
The Theories Of Audit Expectations And The Expectations Gap
Authors: Ecaterina Volosin
1st Edition
3640192311, 978-3640192311