Question
Financial planners may make broad assumptions when building a retirement plan for their clients. This exercise is intended to show one danger in making a
Financial planners may make broad assumptions when building a retirement plan for their clients. This exercise is intended to show one danger in making a blind general assumption when designing a retirement plan.
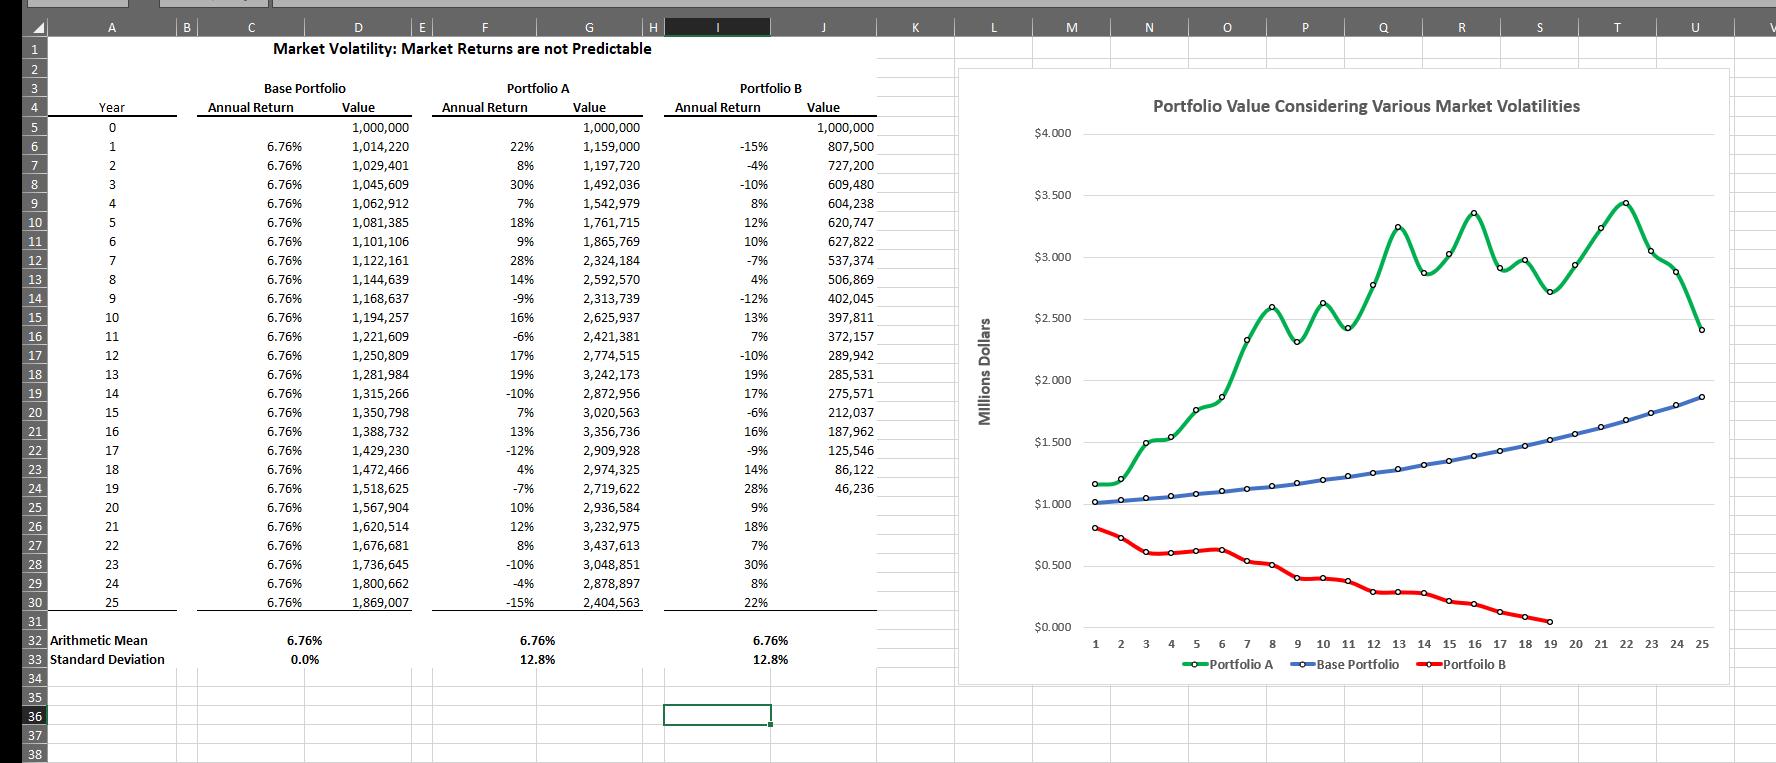
On the attached Excel worksheet, you are presented with three scenarios for a $1,000,000 portfolio where your client annually liquidates $50,000 for their retirement needs. Each portfolio has annual investment returns of 6.76% and the following portfolio volatility (as measured by standard deviation):
- A Base Portfolio - 0.0% standard deviation.
- Portfolio A and Portfolio B - 12.8% standard deviation.
Notice that Portfolio A and B have the same average annual returns and volatility (in fact, they are mirror images of each other), but have dramatically different results on your retiring client.
Critically compare these three portfolios and what accounts for the differing results. As a retirement planning consultant, what conclusions can you draw from your comparison.

1 2 3 4 34 35 A 5 6 7 8 9 10 11 12 13 14 15 16 17 18 19 20 21 22 23 24 25 26 27 28 29 30 31 32 Arithmetic Mean 33 Standard Deviation 36 37 38 Year 0 1 2 3 4 5 6 7 8 9 10 11 12 13 14 15 16 17 18 19 20 21 22 23 24 25 B C D G E F Market Volatility: Market Returns are not Predictable Base Portfolio Annual Return 6.76% 6.76% 6.76% 6.76% 6.76% 6.76% 6.76% 6.76% 6.76% 6.76% 6.76% 6.76% 6.76% 6.76% 6.76% 6.76% 6.76% 6.76% 6.76% 6.76% 6.76% 6.76% 6.76% 6.76% 6.76% 6.76% 0.0% Value 1,000,000 1,014,220 1,029,401 1,045,609 1,062,912 1,081,385 1,101,106 1,122,161 1,144,639 1,168,637 1,194,257 1,221,609 1,250,809 1,281,984 1,315,266 1,350,798 1,388,732 1,429,230 1,472,466 1,518,625 1,567,904 1,620,514 1,676,681 1,736,645 1,800,662 1,869,007 Portfolio A Annual Return 22% 8% 30% 7% 18% 9% 28% 14% -9% 16% -6% 17% 19% -10% 7% 13% -12% 4% -7% 10% 12% 8% -10% -4% -15% 6.76% 12.8% Value 1,000,000 1,159,000 1,197,720 1,492,036 1,542,979 1,761,715 1,865,769 2,324,184 2,592,570 2,313,739 2,625,937 2,421,381 2,774,515 3,242,173 2,872,956 3,020,563 3,356,736 2,909,928 2,974,325 2,719,622 2,936,584 3,232,975 3,437,613 3,048,851 2,878,897 2,404,563 H Portfolio B Annual Return -15% -4% -10% 8% 12% 10% -7% 4% -12% 13% 7% -10% 19% 17% -6% 16% -9% 14% 28% 9% 18% 7% 30% 8% 22% 6.76% 12.8% J Value 1,000,000 807,500 727,200 609,480 604,238 620,747 627,822 537,374 506,869 402,045 397,811 372,157 289,942 285,531 275,571 212,037 187,962 125,546 86,122 46,236 Millions Dollars L M $4.000 $3.500 $3.000 $2.500 $2.000 $1.500 $1.000 $0.500 $0.000 N O P 1 2 3 4 5 6 7 8 --Portfolio A 0 R S Portfolio Value Considering Various Market Volatilities T 9 10 11 12 13 14 15 16 17 18 19 20 21 22 23 24 25 --Base Portfolio Portfoilo B
Step by Step Solution
3.49 Rating (162 Votes )
There are 3 Steps involved in it
Step: 1
ERP is an application that automates business processes and provides insights and internal controls ...
Get Instant Access to Expert-Tailored Solutions
See step-by-step solutions with expert insights and AI powered tools for academic success
Step: 2

Step: 3

Ace Your Homework with AI
Get the answers you need in no time with our AI-driven, step-by-step assistance
Get Started


