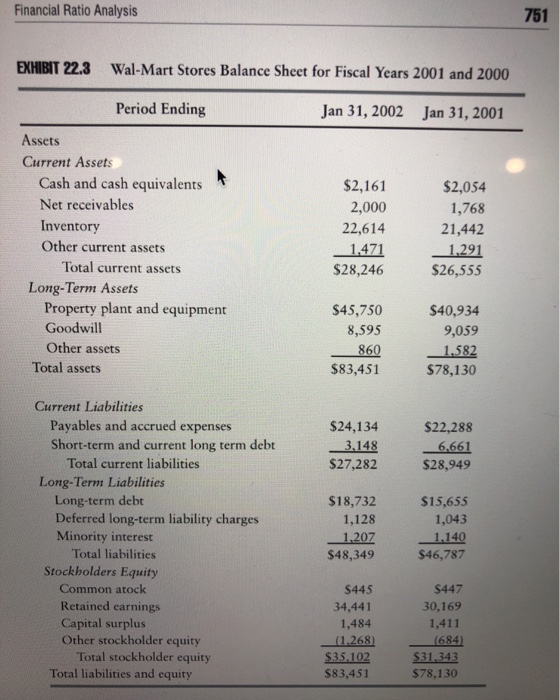
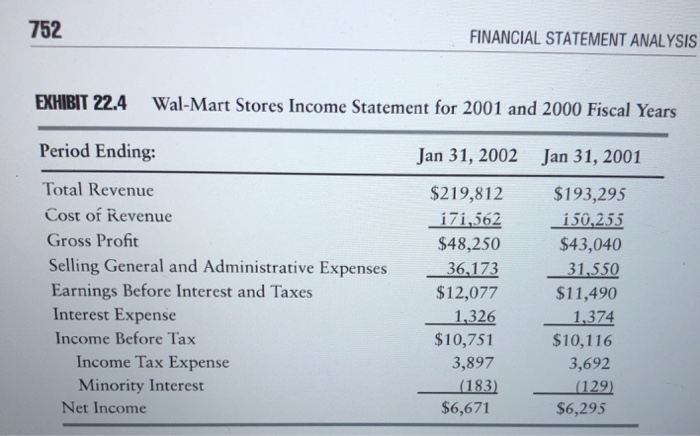
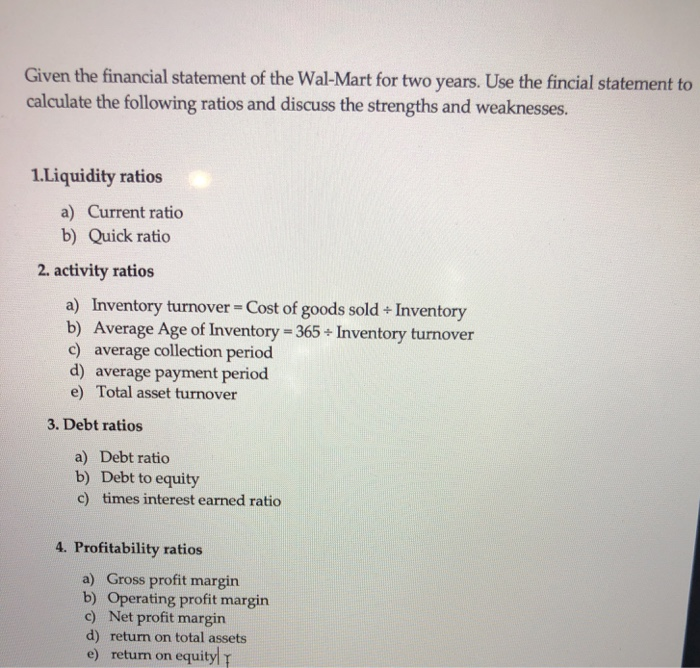
Financial Ratio Analysis EXHIBIT 22.3 Wal-Mart Stores Balance Sheet for Fiscal Years 2001 and 2000 Period Ending Jan 31, 2002 Jan 31, 2001 Assets Current Assets Cash and cash equivalents Net receivables Inventory Other current assets Total current assets Long-Term Assets Property plant and equipment Goodwill Other assets Total assets $2,161 2,000 22,614 1,471 $28,246 $2,054 1,768 21,442 1,291 $26,555 $45,750 8,595 860 $83,451 $40,934 9,059 1,582 $78,130 $24,134 3,148 $27,282 $22,288 6,661 $28,949 Current Liabilities Payables and accrued expenses Short-term and current long term debt Total current liabilities Long-Term Liabilities Long-term debt Deferred long-term liability charges Minority interest Total liabilities Stockholders Equity Common atock Retained earnings Capital surplus Other stockholder equity Total stockholder equity Total liabilities and equity $18,732 1,128 1,207 $48,349 $15,655 1,043 1.140 $46,787 S445 34,441 1,484 (1.268) $35.102 $83,451 $447 30,169 1,411 (684) $31,343 $78,130 752 FINANCIAL STATEMENT ANALYSIS EXHIBIT 22.4 Wal-Mart Stores Income Statement for 2001 and 2000 Fiscal Years Period Ending: Jan 31, 2002 Jan 31, 2001 Total Revenue Cost of Revenue Gross Profit Selling General and Administrative Expenses Earnings Before Interest and Taxes Interest Expense Income Before Tax Income Tax Expense Minority Interest Net Income $219,812 | i71,562 $48,250 36,173 $12,077 | 1,326 $10,751 3,897 (183) $6,671 $193,295 i 50,255 $43,040 31,550 $11,490 1,374 $10,116 3,692 (129) $6,295 Given the financial statement of the Wal-Mart for two years. Use the fincial statement to calculate the following ratios and discuss the strengths and weaknesses. 1.Liquidity ratios a) Current ratio b) Quick ratio 2. activity ratios a) Inventory turnover = Cost of goods sold + Inventory b) Average Age of Inventory = 365 - Inventory turnover c) average collection period d) average payment period e) Total asset turnover 3. Debt ratios a) Debt ratio b) Debt to equity c) times interest earned ratio 4. Profitability ratios a) Gross profit margin b) Operating profit margin c) Net profit margin d) return on total assets e) return on equity


