Question
Financial Ratio Analysis : Ratios 2014 2015 Describing Liquidity Ratios Current ratio Quick (acid test) ratio Inventory to net working capital Cash ratio Profitability Ratios

Financial Ratio Analysis :
| Ratios | 2014 | 2015 | Describing |
| Liquidity Ratios
| |||
| Current ratio |
|
|
|
| Quick (acid test) ratio |
|
|
|
| Inventory to net working capital |
|
|
|
| Cash ratio |
|
|
|
| Profitability Ratios | |||
| Net profit margin |
|
|
|
| Gross profit margin |
|
|
|
| Return on investment (ROI) |
|
|
|
| Return on equity (ROE) |
|
|
|
| Earnings per share (EPS) |
|
|
|
| Activity Ratios | |||
| Inventory turnover |
|
|
|
| Days of inventory |
|
|
|
| Net working capital turnover |
|
|
|
| Asset turnover |
|
|
|
| Fixed asset Turnover |
|
|
|
| Average collection period |
|
|
|
| Asset turnover |
|
|
|
| Fixed asset Turnover |
|
|
|
| Average collection period |
|
|
|
| Accounts receivable turnover |
|
|
|
| Accounts payable Period |
|
|
|
| Days of cash |
|
|
|
| Leverage Ratios | |||
| Debt-to-asset ratio |
|
|
|
| Debt-to-equity ratio |
|
|
|
| Long-term debt to capital structure |
|
|
|
| Times interest earned |
|
|
|
| Coverage of fixed charges |
|
|
|
| Current liabilities to equity |
|
|
|
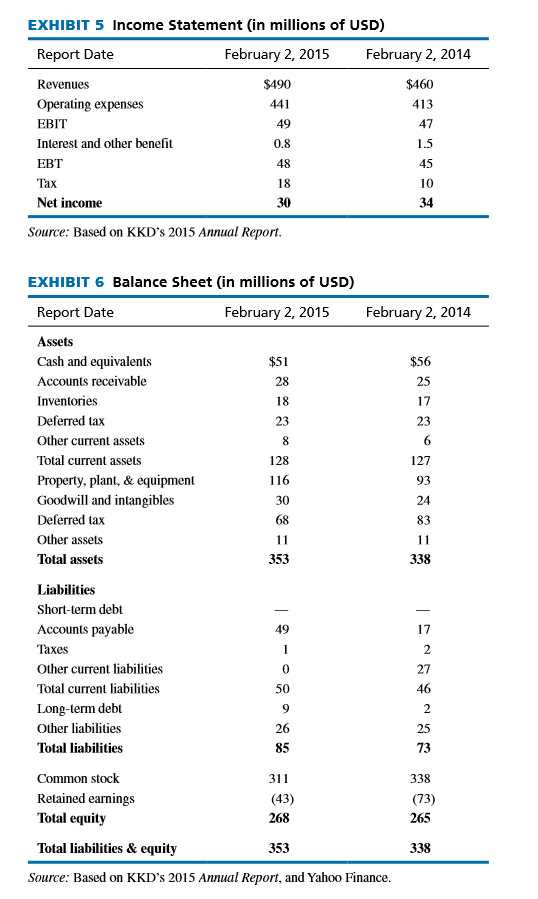
EXHIBIT 5 Income Statement (in millions of USD) Report Date February 2, 2015 February 2, 2014 Revenues $190 $460 Operating expenses 441 413 EBIT 49 47 Interest and other benefit 0.8 1.5 48 45 Tax 18 10 Net income 30 34 Source: Based on KKD's 2015 Annual Report. February 2, 2014 28 $56 25 17 18 23 8 23 6 127 93 24 116 83 EXHIBIT 6 Balance Sheet (in millions of USD) Report Date February 2, 2015 Assets Cash and equivalents $51 Accounts receivable Inventories Deferred tax Other current assets Total current assets 128 Property, plant, & equipment Goodwill and intangibles 30 Deferred tax 68 Other assets 11 Total assets 353 Liabilities Short-term debt Accounts payable Taxes Other current liabilities Total current liabilities Long-term debt Other liabilities 26 Total liabilities 85 Common stock Retained earnings (43) Total equity 268 11 338 49 17 2 0 27 50 46 9 2 25 73 311 338 (73) 265 Total liabilities & equity 353 338 Source: Based on KKD's 2015 Annual Report, and Yahoo Finance
Step by Step Solution
There are 3 Steps involved in it
Step: 1

Get Instant Access to Expert-Tailored Solutions
See step-by-step solutions with expert insights and AI powered tools for academic success
Step: 2

Step: 3

Ace Your Homework with AI
Get the answers you need in no time with our AI-driven, step-by-step assistance
Get Started


