Answered step by step
Verified Expert Solution
Question
1 Approved Answer
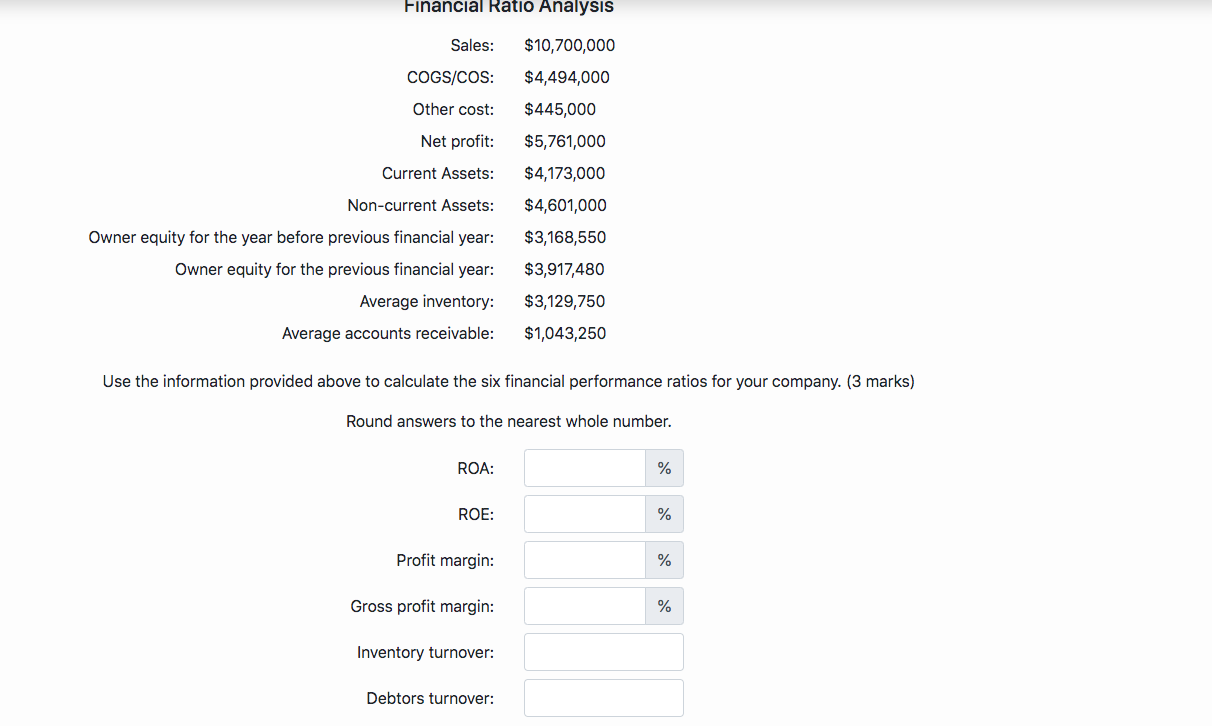
Financial Ratio Analysis Sales: COGS/COS: Other cost: Net profit: $10,700,000 $4,494,000 $445,000 $5,761,000 $4,173,000 $4,601,000 $3,168,550 Current Assets: Non-current Assets: Owner equity for the year
Step by Step Solution
There are 3 Steps involved in it
Step: 1

Get Instant Access to Expert-Tailored Solutions
See step-by-step solutions with expert insights and AI powered tools for academic success
Step: 2

Step: 3
Ace Your Homework with AI
Get the answers you need in no time with our AI-driven, step-by-step assistance
Get Started