

Answered step by step
Verified Expert Solution
Question
1 Approved Answer
Financial ratio-average below: LIQUIDITY 2018 2017 2016 2015 28.80 Days' Sales in Receivables Accounts Receivable Turnover A/R Turnover in Days 37.72 10.48 34.84 32.09 11.55
Financial ratio-average below:
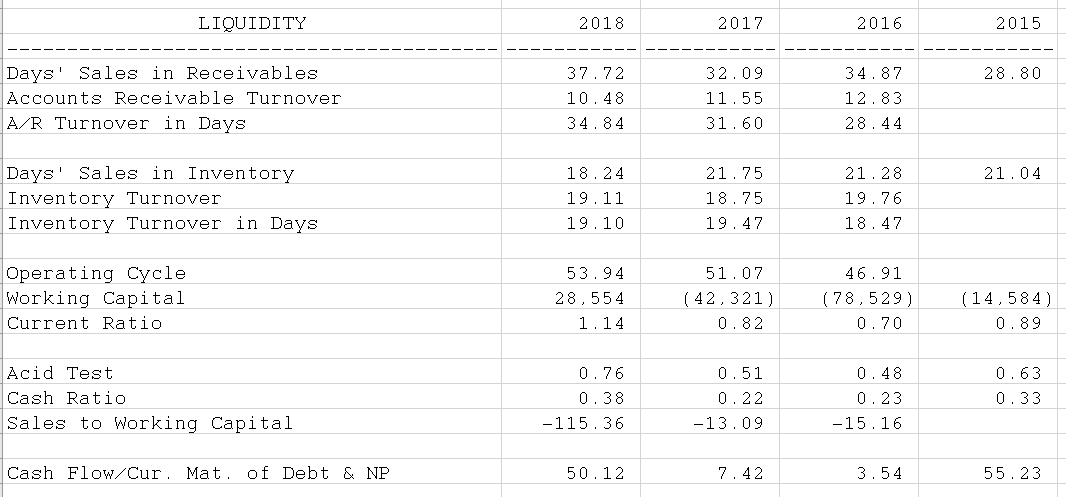
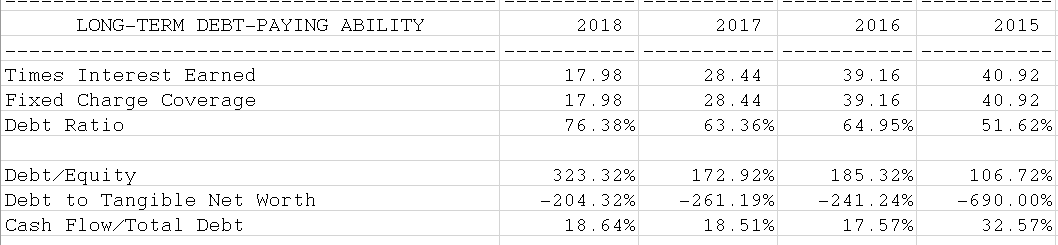
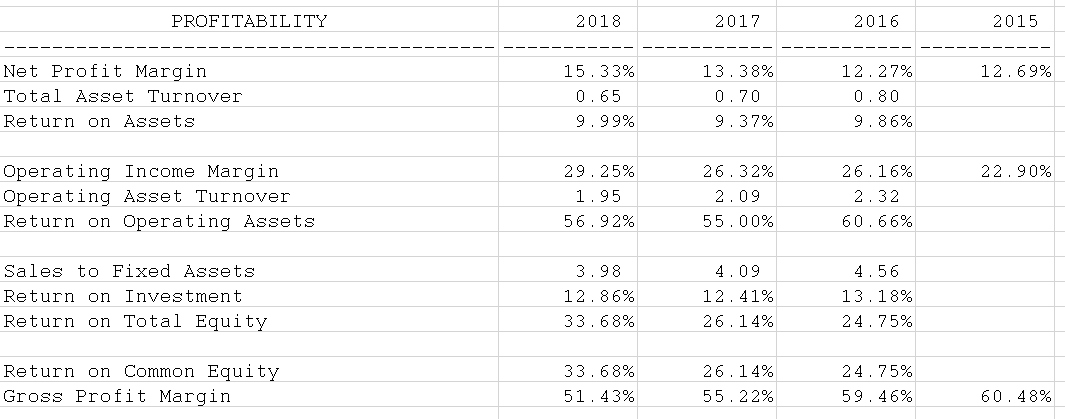
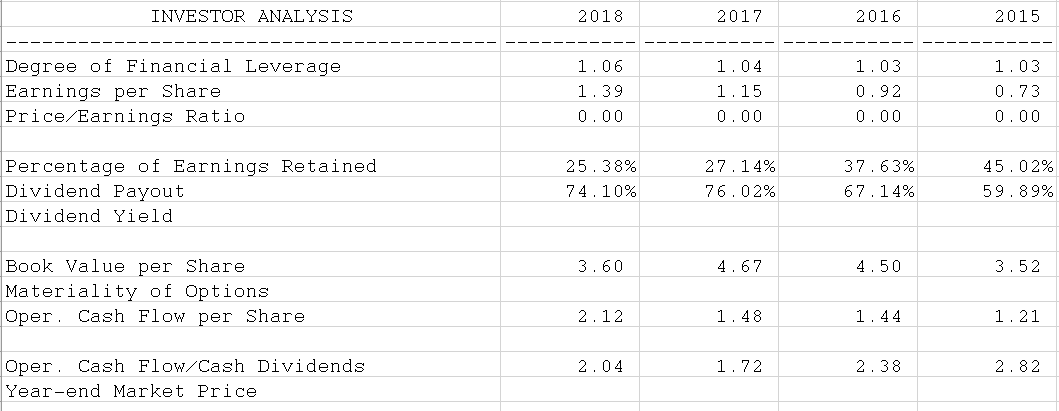
LIQUIDITY 2018 2017 2016 2015 28.80 Days' Sales in Receivables Accounts Receivable Turnover A/R Turnover in Days 37.72 10.48 34.84 32.09 11.55 31.60 34.87 12.83 28.44 21.04 Days' Sales in Inventory Inventory Turnover Inventory Turnover in Days 18.24 19.11 19.10 21.75 18.75 19.47 21.28 19.76 18. 47 Operating Cycle Working Capital Current Ratio 53.94 28,554 1.14 51.07 (42.321) 0.82 46.91 (78,529) 0.70 (14,584) 0.89 Acid Test Cash Ratio Sales to Working Capital 0.76 0.38 -115. 36 0.51 0.22 -13.09 0.48 0.23 -15.16 0.63 0.33 Cash Flow/Cur. Mat. of Debt & NP 50.12 7.42 3.54 55.23 LONG-TERM DEBT-PAYING ABILITY 2018 2017 2016 2015 Times Interest Earned Fixed Charge Coverage Debt Ratio 17.98 17.98 76.38% 28. 44 28. 44 63.36% 39.16 39.16 64.95% 40.92 40.92 51.62% Debt/Equity Debt to Tangible Net Worth Cash Flow/Total Debt 323.32% -204.32% 18.64% 172.92% -261.19% 18.51% 185.32% - 241.24% 17.57% 106.72% -690.00% 32.57% PROFITABILITY 2018 2017 2016 2015 12.69% Net Profit Margin Total Asset Turnover Return on Assets 15.33% 0.65 9.99% 13.38% 0.70 9.37% 12.27% 0.80 9.86% 22.90% Operating Income Margin Operating Asset Turnover Return on Operating Assets 29. 25% 1.95 56.92% 26.32% 2.09 55.00% 26.16% 2.32 60.66% Sales to Fixed Assets Return on Investment Return on Total Equity 3.98 12.86% 33.68% 4.09 12.41% 26.14% 4.56 13.18% 24.75% Return on Common Equity Gross Profit Margin 33.68% 51.43% 26.14% 55.22% 24.75% 59. 46% 60.48% INVESTOR ANALYSIS 2018 2017 2016 2015 Degree of Financial Leverage Earnings per Share Price/Earnings Ratio 1.06 1.39 0.00 1.04 1.15 0.00 1.03 0.92 0.00 1.03 0.73 0.00 Percentage of Earnings Retained Dividend Payout Dividend Yield 25.38% 74.10% 27.14% 76.02% 37.63% 67.14% 45.02% 59.89% 3.60 4.67 4.50 3.52 Book Value per Share Materiality of Options Oper. Cash Flow per Share 2.12 1.48 1.44 1.21 2.04 1.72 2.38 2.82 Oper. Cash Flow/Cash Dividends Year-end Market Price LIQUIDITY 2018 2017 2016 2015 28.80 Days' Sales in Receivables Accounts Receivable Turnover A/R Turnover in Days 37.72 10.48 34.84 32.09 11.55 31.60 34.87 12.83 28.44 21.04 Days' Sales in Inventory Inventory Turnover Inventory Turnover in Days 18.24 19.11 19.10 21.75 18.75 19.47 21.28 19.76 18. 47 Operating Cycle Working Capital Current Ratio 53.94 28,554 1.14 51.07 (42.321) 0.82 46.91 (78,529) 0.70 (14,584) 0.89 Acid Test Cash Ratio Sales to Working Capital 0.76 0.38 -115. 36 0.51 0.22 -13.09 0.48 0.23 -15.16 0.63 0.33 Cash Flow/Cur. Mat. of Debt & NP 50.12 7.42 3.54 55.23 LONG-TERM DEBT-PAYING ABILITY 2018 2017 2016 2015 Times Interest Earned Fixed Charge Coverage Debt Ratio 17.98 17.98 76.38% 28. 44 28. 44 63.36% 39.16 39.16 64.95% 40.92 40.92 51.62% Debt/Equity Debt to Tangible Net Worth Cash Flow/Total Debt 323.32% -204.32% 18.64% 172.92% -261.19% 18.51% 185.32% - 241.24% 17.57% 106.72% -690.00% 32.57% PROFITABILITY 2018 2017 2016 2015 12.69% Net Profit Margin Total Asset Turnover Return on Assets 15.33% 0.65 9.99% 13.38% 0.70 9.37% 12.27% 0.80 9.86% 22.90% Operating Income Margin Operating Asset Turnover Return on Operating Assets 29. 25% 1.95 56.92% 26.32% 2.09 55.00% 26.16% 2.32 60.66% Sales to Fixed Assets Return on Investment Return on Total Equity 3.98 12.86% 33.68% 4.09 12.41% 26.14% 4.56 13.18% 24.75% Return on Common Equity Gross Profit Margin 33.68% 51.43% 26.14% 55.22% 24.75% 59. 46% 60.48% INVESTOR ANALYSIS 2018 2017 2016 2015 Degree of Financial Leverage Earnings per Share Price/Earnings Ratio 1.06 1.39 0.00 1.04 1.15 0.00 1.03 0.92 0.00 1.03 0.73 0.00 Percentage of Earnings Retained Dividend Payout Dividend Yield 25.38% 74.10% 27.14% 76.02% 37.63% 67.14% 45.02% 59.89% 3.60 4.67 4.50 3.52 Book Value per Share Materiality of Options Oper. Cash Flow per Share 2.12 1.48 1.44 1.21 2.04 1.72 2.38 2.82 Oper. Cash Flow/Cash Dividends Year-end Market Price
Step by Step Solution
There are 3 Steps involved in it
Step: 1

Get Instant Access to Expert-Tailored Solutions
See step-by-step solutions with expert insights and AI powered tools for academic success
Step: 2

Step: 3
Ace Your Homework with AI
Get the answers you need in no time with our AI-driven, step-by-step assistance
Get Started
Sustainability Success In Business A Practical Guide To Managing Climate Risk In Your Organisation
Authors: Megyn Carpenter
1922375209, 978-1922375209