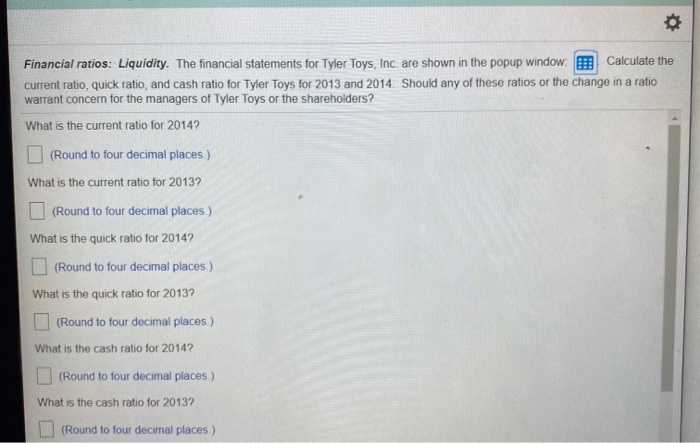
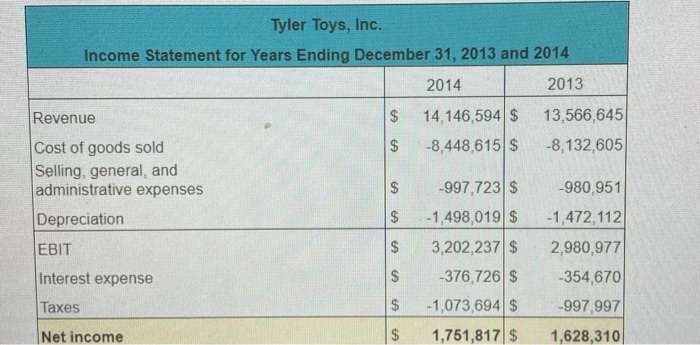
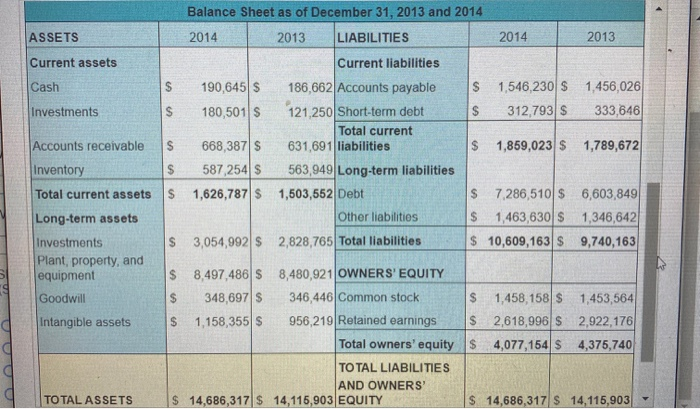
Financial ratios: Liquidity. The financial statements for Tyler Toys, Inc. are shown in the popup window. Calculate the current ratio, quick ratio, and cash ratio for Tyler Toys for 2013 and 2014. Should any of these ratios or the change in a ratio warrant concern for the managers of Tyler Toys or the shareholders? What is the current ratio for 2014? (Round to four decimal places) What is the current ratio for 2013? (Round to four decimal places.) What is the quick ratio for 2014? (Round to four decimal places) What is the quick ratio for 2013? (Round to four decimal places.) What is the cash ratio for 2014? (Round to four decimal places) What is the cash ratio for 2013? (Round to four decimal places.) O A The ratios look reasonable and the change shows improving liquidity for all ratios. O B . The ratios look reasonable and the change shows improving liquidity for all ratios except the cash ratio OC. The ratios do not look reasonable and the managers of Tyler Toys should make the appropriate adjustments OD. The ratios look reasonable and the change shows deteriorating liquidity for all ratios. Tyler Toys, Inc. Income Statement for Years Ending December 31, 2013 and 2014 2014 2013 Revenue $ 14,146,594 $ 13,566,645 Cost of goods sold -8,448,615 $ -8,132,605 Selling, general, and administrative expenses | -997,723 $ -980,951 Depreciation $ -1,498,019 $ 1.472.112 3,202,237 $ 2,980,977 Interest expense -376,726 $ -354,670 Taxes S -1,073,694 $ -997,997 Net income $ 1,751,817 $ 1,628,310 EBIT $ ASSETS 2014 Current assets Cash Investments Accounts receivable Inventory Total current assets Long-term assets Investments Plant, property, and equipment Goodwill Intangible assets Balance Sheet as of December 31, 2013 and 2014 2013 LIABILITIES 2014 2013 Current liabilities 190,645 S 186,662 Accounts payable $ 1,546,230 S 1.456,026 180,501 S 121,250 Short-term debt 312,793 S 333,646 Total current S 668,387 $ 631,691 liabilities 1,859,023 S 1,789,672 $ 587 254 S 563,949 Long-term liabilities S 1,626,787 S 1,503,552 Debt 7,286,510 $ 6,603,849 Other liabilities $ 1,463,630 S 1,346,642 $ 3,054,992 $ 2,828,765 Total liabilities $ 10,609,163 $ 9,740,163 $ 8,497,486 S 8,480,921 OWNERS' EQUITY $ 348,697 S 346,446 Common stock $ 1,458,158 $ 1,453,564 $ 1,158,355 $ 956,219 Retained earnings S 2,618,996 S 2,922,176 Total owners' equity $ 4,077,154 S 4,375,740 TOTAL LIABILITIES AND OWNERS $ 14,686,317 $ 14,115,903 EQUITY $ 14,686,317 S 14,115,903 000 TOTAL ASSETS


