Answered step by step
Verified Expert Solution
Question
1 Approved Answer
Financial Reports for 5 Different Retailers, 2016 & 2017 (in $ million) Q1, Q2, Q3, Q4, 2016 2016 2016 2016 AllStore Sales 20.00 20.50 20.70
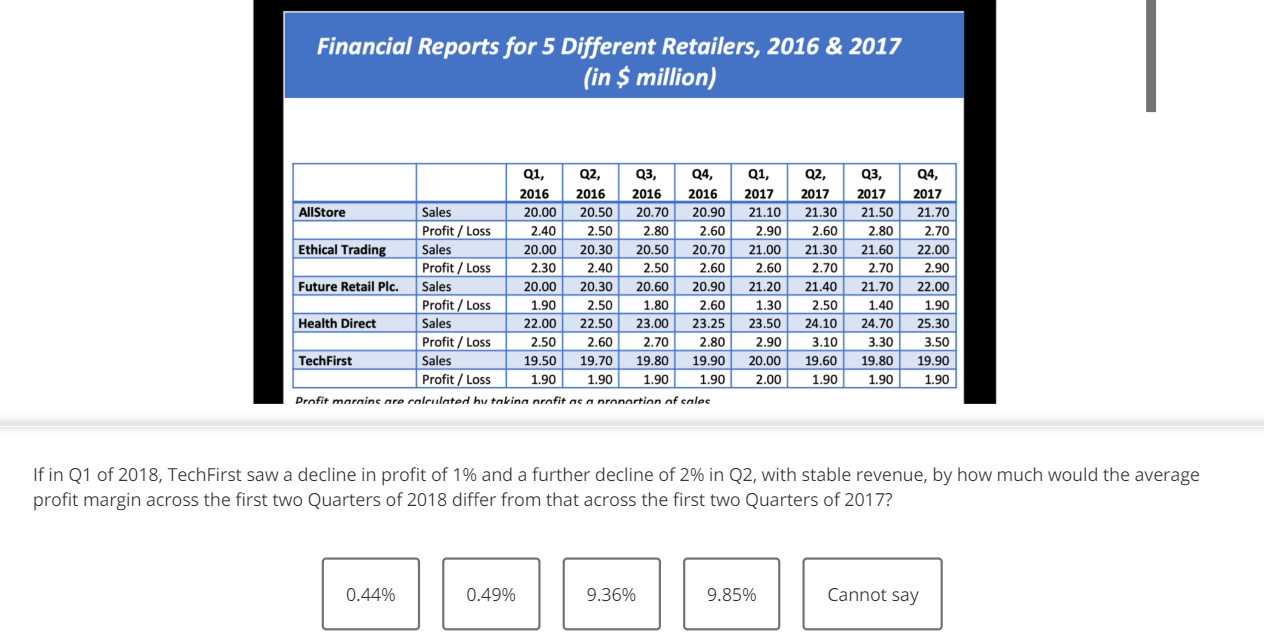
Financial Reports for 5 Different Retailers, 2016 & 2017 (in $ million) Q1, Q2, Q3, Q4, 2016 2016 2016 2016 AllStore Sales 20.00 20.50 20.70 20.90 Profit / Loss 2.40 2.50 2.80 2.60 Ethical Trading Sales 20.00 20.30 20.50 20.70 Profit / Loss 2.30 2.40 2.50 2.60 Future Retail Plc. Sales 20.00 20.30 20.60 20.90 Profit / Loss 1.90 2.50 1.80 2.60 Health Direct Sales 22.00 22.50 23.00 23.25 Profit / Loss 2.50 2.60 2.70 2.80 TechFirst Sales 19.50 19.70 19.80 19.90 Profit / Loss 1.90 1.90 1.90 1.90 Profit mornine nre rolulnted hu takinn nrofit ne n nrnnortinn af enlec Q1, 2017 21.10 2.90 21.00 2.60 21.20 1.30 23.50 2.90 20.00 2.00 Q2, 2017 21.30 2.60 21.30 2.70 21.40 2.50 24.10 3.10 19.60 1.90 Q3, Q4, 2017 2017 21.50 21.70 2.80 12.70 21.60 22.00 2.70 2.90 21.70 22.00 1.40 1.90 24.70 25.30 3.30 3.50 19.80 19.90 1.90 1.90 If in Q1 of 2018, TechFirst saw a decline in profit of 1% and a further decline of 2% in Q2, with stable revenue, by how much would the average profit margin across the first two Quarters of 2018 differ from that across the first two Quarters of 2017? 0.44% 0.49% 9.36% 9.85% Cannot say
Step by Step Solution
There are 3 Steps involved in it
Step: 1
Get Instant Access to Expert-Tailored Solutions
See step-by-step solutions with expert insights and AI powered tools for academic success
Step: 2
Step: 3
Ace Your Homework with AI
Get the answers you need in no time with our AI-driven, step-by-step assistance
Get Started