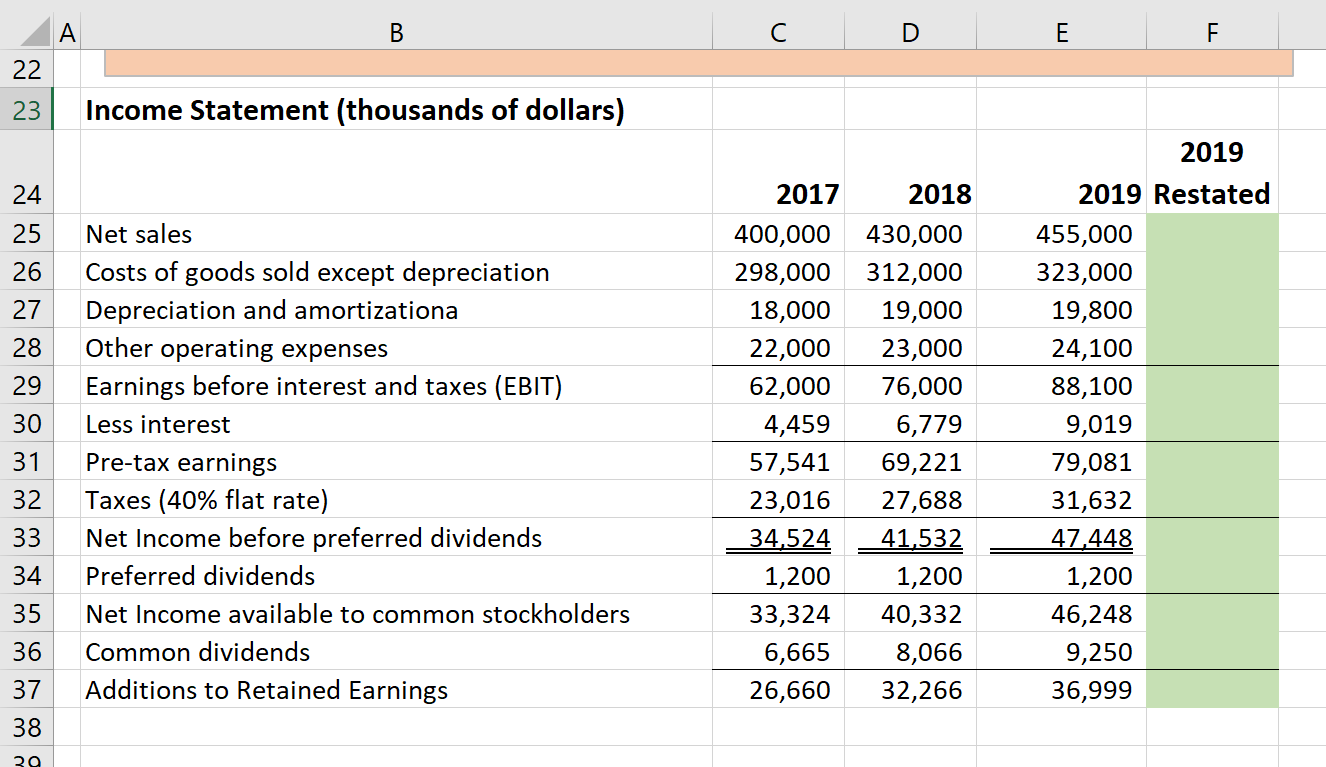
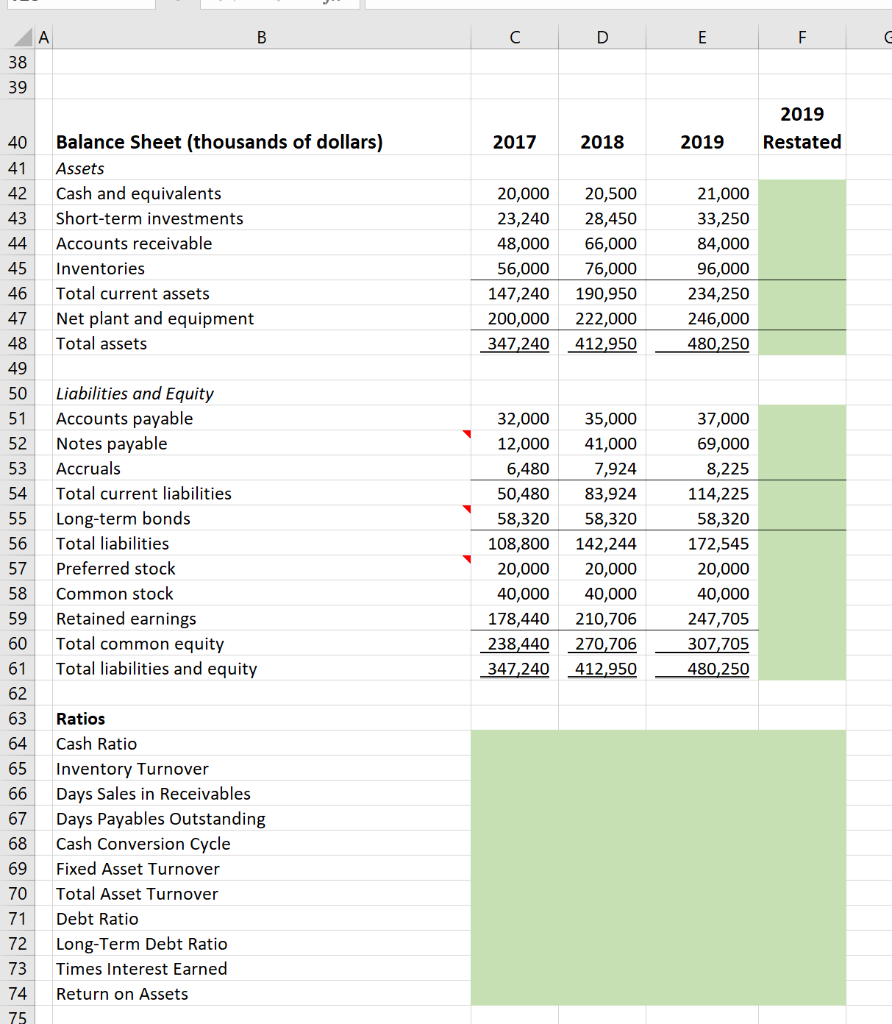
Financial results for the last three fiscal years for LoMax Corp. are presented below.
FIRST, Compute the requested ratios in the green shaded cells beneath the financials, then answer the thought question related to the ratios.
SECOND, Restate the 2019 numbers given the following assumptions:
1. The firm achieved an Inventory Turnover of 6.0 in 2019.
2. The firm achieved a Receivables Turnover of 11.5 in 2019.
3. The firm paid all its invoices on Day 30.
4. The firm will use any net positive cash created by theses changes along with all of its marketable securities to repay debt, starting with Notes Payable then Long-Term bonds.
5. Any interest expense saved from debt repayment will increase Pre-tax earnings.
6. Additions to Retained Earnings will be held constant. Any extra funds available will be used to increase the common dividend.
7. Any account not affected by the changes specified above will be held constant.
LASTLY, After completing your 2019 restatement, compute ratios for the restated financials and answer the discussion question below.


C D E F 22 23 Income Statement (thousands of dollars) 24 25 26 27 28 29 30 31 32 33 Net sales Costs of goods sold except depreciation Depreciation and amortizationa Other operating expenses Earnings before interest and taxes (EBIT) Less interest Pre-tax earnings Taxes (40% flat rate) Net Income before preferred dividends Preferred dividends Net Income available to common stockholders Common dividends Additions to Retained Earnings 2017 400,000 298,000 18,000 22,000 62,000 4,459 57,541 23,016 34,524 1,200 33,324 6,665 26,660 2018 430,000 312,000 19,000 23,000 76,000 6,779 69,221 27,688 41,532 1,200 40,332 8,066 32,266 2019 2019 Restated 455,000 323,000 19,800 24,100 88,100 9,019 79,081 31,632 47.448 1,200 46,248 9,250 36,999 34 35 36 37 38 39 C D E F E 2019 Restated 2017 2018 2019 RE 44 45 46 47 Balance Sheet (thousands of dollars) Assets Cash and equivalents Short-term investments Accounts receivable Inventories Total current assets Net plant and equipment Total assets 20,000 23,240 48,000 56,000 147,240 200,000 347,240 20,500 28,450 66,000 76,000 190,950 222,000 412,950 21,000 33,250 84,000 96,000 234,250 246,000 480,250 51 54 Liabilities and Equity Accounts payable Notes payable Accruals Total current liabilities Long-term bonds Total liabilities Preferred stock Common stock Retained earnings Total common equity Total liabilities and equity 32,000 12,000 6,480 50,480 58,320 108,800 20,000 40,000 178,440 238,440 347,240 35,000 41,000 7,924 83,924 58,320 142,244 20,000 40,000 210,706 270,706 412,950 37,000 69,000 8,225 114,225 58,320 172,545 20,000 40,000 247,705 307,705 480,250 58 59 60 61 - 63 64 67 68 Ratios Cash Ratio Inventory Turnover Days Sales in Receivables Days Payables Outstanding Cash Conversion Cycle Fixed Asset Turnover Total Asset Turnover Debt Ratio Long-Term Debt Ratio Times Interest Earned Return on Assets 70 71 72 73 74 75 C D E F 22 23 Income Statement (thousands of dollars) 24 25 26 27 28 29 30 31 32 33 Net sales Costs of goods sold except depreciation Depreciation and amortizationa Other operating expenses Earnings before interest and taxes (EBIT) Less interest Pre-tax earnings Taxes (40% flat rate) Net Income before preferred dividends Preferred dividends Net Income available to common stockholders Common dividends Additions to Retained Earnings 2017 400,000 298,000 18,000 22,000 62,000 4,459 57,541 23,016 34,524 1,200 33,324 6,665 26,660 2018 430,000 312,000 19,000 23,000 76,000 6,779 69,221 27,688 41,532 1,200 40,332 8,066 32,266 2019 2019 Restated 455,000 323,000 19,800 24,100 88,100 9,019 79,081 31,632 47.448 1,200 46,248 9,250 36,999 34 35 36 37 38 39 C D E F E 2019 Restated 2017 2018 2019 RE 44 45 46 47 Balance Sheet (thousands of dollars) Assets Cash and equivalents Short-term investments Accounts receivable Inventories Total current assets Net plant and equipment Total assets 20,000 23,240 48,000 56,000 147,240 200,000 347,240 20,500 28,450 66,000 76,000 190,950 222,000 412,950 21,000 33,250 84,000 96,000 234,250 246,000 480,250 51 54 Liabilities and Equity Accounts payable Notes payable Accruals Total current liabilities Long-term bonds Total liabilities Preferred stock Common stock Retained earnings Total common equity Total liabilities and equity 32,000 12,000 6,480 50,480 58,320 108,800 20,000 40,000 178,440 238,440 347,240 35,000 41,000 7,924 83,924 58,320 142,244 20,000 40,000 210,706 270,706 412,950 37,000 69,000 8,225 114,225 58,320 172,545 20,000 40,000 247,705 307,705 480,250 58 59 60 61 - 63 64 67 68 Ratios Cash Ratio Inventory Turnover Days Sales in Receivables Days Payables Outstanding Cash Conversion Cycle Fixed Asset Turnover Total Asset Turnover Debt Ratio Long-Term Debt Ratio Times Interest Earned Return on Assets 70 71 72 73 74 75


