Question
Financial Statement Analysis Project Now that you have studied the chapters involved in this Financial Accounting 2 course, I do not expect you to be


 Financial Statement Analysis Project
Now that you have studied the chapters involved in this Financial Accounting 2 course, I do not expect you to be a professional business analyst but you should have a pretty good handle on analyzing a public corporations financial statements (or knowing where to look for the answers) by knowing what dollar numbers you need, as well as what they mean. Buying a car, a house, and/or receiving a new credit card are just some of the ways you may have already encountered a company lending you money for your purchases. Now you will be on the other side of the desk in deciding whether or not you would be willing to give Netflix a loan.
The story line for your project is that you are the senior lending officer of a very large worldwide bank and Netflix has come to you to ask for a loan. They need to borrow $2,000,000 and will pay you back within 5 years from time of borrowing. They are going to use this money to update their software as they feel many users are giving their codes to their family and friends instead of their friends and families becoming members themselves. They need to create a larger department to write codes to try to prevent this from happening.
You will of course have to crunch numbers as shown in CH 15 and tell me what those numbers mean (in your own words) as part of your decision making. Its your job to be very sure the bank will get paid back. You will also go on line to see what others think of Netflixs future, deciding if you agree or disagree and then examine that information to see if Netflix meets your banks criteria. Be sure to attach URL information as to what others think about them to your word document
You will need to use Word and Excel for this project I expect correct grammar in the Word document and formulas within the Excel spreadsheets. I do not just want the answer on the spreadsheet I want the actual formula and as shown in the first example I made for you in Excel. The Word document should explain what it means (in your words) and the for or against or neutral for your own criteria in that paragraph.
I will expect 2 documents back from you. The Excel spreadsheet of which I answer the first formula driven question (you will use this for the other formula driven questions) and the Word document giving me what the information means in relationship to the loan in question. Simply type your answers within the pages given.
Ps. It would be good to find out who Netflixs largest competitors are?
Name: Course: FIN ACC 2, SU2 2021
CH 8
-How much accounts receivable did Netflix report on its balance sheet as of December 31, 2020? As of 2019?
-Refer to the Netflix notes, what types of receivables are included in their Other Current Assets?
-What method does Netflix use to account for their possible bad debt from customers? Does this sound like a good method to you? Why?
-Compute Netflixs acid ratio test as of end of 2020 and another for 2019. Did the year-to-year ratio improve or deteriorate? For each date, if all current liabilities came due immediately, could Netflix pay them off?
-Compute Netflixs current ratio test as of end of 2020 and another for 2019. Did the year-to-year comparison ratio improve or deteriorate? For each date, if all current liabilities came due immediately, could Netflix pay them off?
CH 9
-What depreciation method does Netflix use for reporting in the financial statement? What are the income and tax ramifications in using this method?
-What was the amount of depreciation for the year ended Dec 2020?
-The statement of cash flow reports the cash purchases of pp&e (property plant and equipment). How much were Netflixs paid cash additions to property, plant and equipment during the 2020 year? Did you see any cash sale from the sale of pp&e? If so, how much?
-What was the amount of accumulated depreciation at Dec 31, 2020. What was the net book value of the long-term assets?
-Compute Netflixs asset turnover ratio ending Dec 31, 2020. Round to two decimals. How does? Netflixs ratio compare with its largest competitor? Who is the largest competitor??
CH 10
-Compute the rate of return on total assets for Netflix for 2020, also compute its largest competitors ratio, whats the difference? Is Netflix better or worse?
-How much was Netflix long term debt for 2020 and 2019.
-Compute the debt-to-equity ratio for both years, how does it compare? Any ideas why?
CH 11
-Give the breakdown of Netflixs current liabilities as of Dec 2020. How does that compare to 2019? Any big differences? What and why? (hint, hint, check the notes)
-Calculate the times-interest-earned ratio for 2020 and 2019. Comment if you feel they differ significantly.
CH 12
-How much was Netflixs long-term debt for 2020?
-Please read all the way through note 6 on pages 56 and 57. Give me a short paragraph of what you understood? (Believe me this is not a trick question. I only want to know how much an introductory textbook helps new accounting students understand financial statements, remember that to become an accountant you need not only intro accounting but intermediate and then advanced!! Now you can see why!)
-How many legal proceedings is Netflix concerned about? Are you? Why or why not?
CH 13
-Review to the Stockholders Equity section of the Consolidated Balance Sheets. Does Netflix have any preferred Stock? If so, how much? How much is authorized?
-How much Netflix Common stock is authorized and what does that mean?
-How much stock is outstanding for 2020 and what does that mean?
-Did they buy any back? If so, why?
-How much were the dividends per a share of stock actually given back to the stockholders in 2020? Is that important to you? Why?
CH 14
| -Which method did Netflix use to report net cash flow from operating activities? |
| -Evaluate NETFLIXS Statement of Cash Flows for the year, Mention all 3 cash flows and how you think they are doing with the handling of their cash. |
| -If Netflix plans similar activities for 2021 what is there expected free cash flow? |
| -What type of non-cash adjustments to net income did Netflix repot for 2018? |
| -What was the actual cash provided for investing activities? |
| -Were you surprised at any of the activities with either the receiving or using of cash? If so which ones and why? |
CH 15
-What was a share of stock selling for the close of day on Dec 31, 2020? What is a share of stock selling for as of the close of day June 18, 2021?
-Throughout the project I have asked you to formulate and give me back some analysis and ratios. I have no specific questions for you for this chapter, however, if you go through the formulas on this chapter, feel free to use any others?
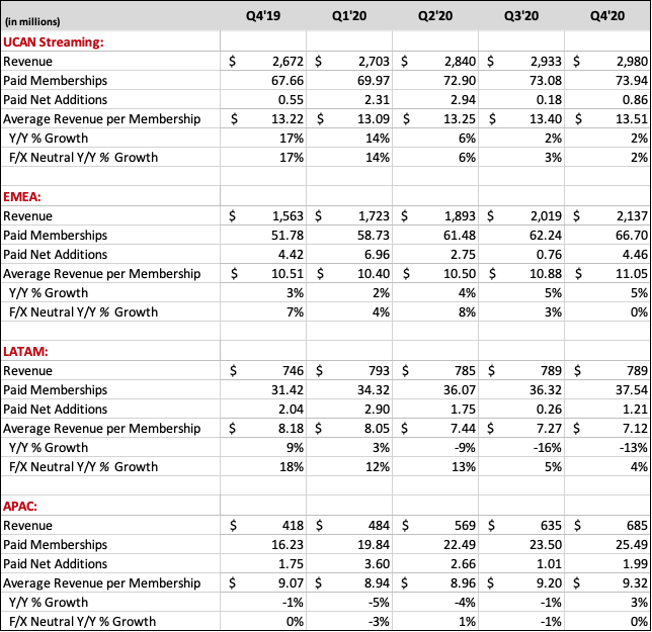
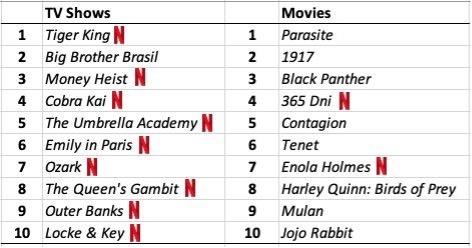
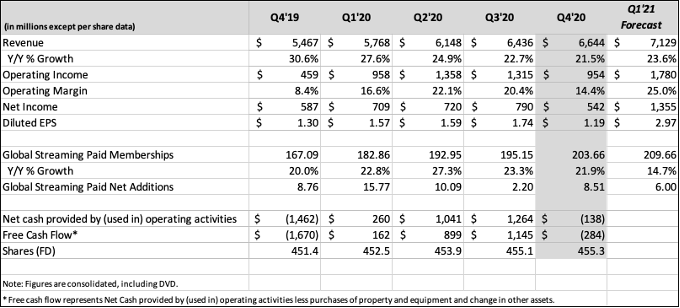
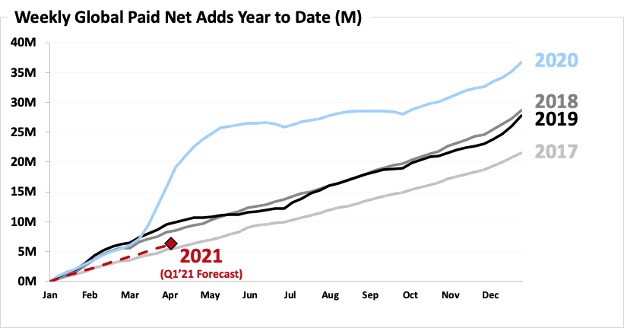
Q4'19 Q120 Q2'20 Q3'20 Q4'20 $ (in millions) UCAN Streaming: Revenue Paid Memberships Paid Net Additions Average Revenue per Membership Y/ % Growth F/X Neutral Y/ % Growth 2,672 $ 67.66 0.55 13.22 $ 17% 17% 2,703 $ 69.97 2.31 13.09 $ 14% 14% 2,840 $ 72.90 2.94 13.25 $ 6% 6% 2,933 $ 73.08 0.18 13.40 $ 2% 3% 2,980 73.94 0.86 13.51 2% 2% $ $ $ EMEA: Revenue Paid Memberships Paid Net Additions Average Revenue per Membership YNY% Growth F/X Neutral Y/V % Growth 1,563 $ 51.78 4.42 10.51 $ 3% 7% 1,723 $ 58.73 6.96 10.40 $ 2% 4% 1,893 $ 61.48 2.75 10.50 $ 4% 8% 2,019 $ 62.24 0.76 10.88 $ 5% 3% 2,137 66.70 4.46 11.05 5% 0% $ $ $ LATAM: Revenue Paid Memberships Paid Net Additions Average Revenue per Membership Y/Y% Growth F/X Neutral YN % Growth 746 $ 31.42 2.04 8.18 $ 9% 793 $ 34.32 2.90 8.05 $ 3% 785 $ 36.07 1.75 7.44 $ -9% 789 $ 36.32 0.26 7.27 $ -16% 5% 789 37.54 1.21 7.12 - 13% 4% $ 18% 12% 13% $ $ APAC: Revenue Paid Memberships Paid Net Additions Average Revenue per Membership Y/% Growth F/X Neutral Y/V % Growth 418 $ 16.23 1.75 9.07 $ -1% 0% 484 $ 19.84 3.60 8.94 $ -5% -3% 569 $ 22.49 2.66 8.96 $ -4% 1% 635 $ 23.50 1.01 9.20 $ - 1% - 1% 685 25.49 1.99 9.32 3% 0% $ NH TV Shows 1 Tiger King N 2 Big Brother Brasil 3 Money Heist N 4 Cobra Kai N 5 The Umbrella Academy N 6 Emily in Paris N 7 Ozark N 8 The Queen's Gambit N 9 Outer Banks N 10 Locke & Key N Movies 1 Parasite 2 1917 3 Black Panther 4 365 Dni N 5 Contagion 6 Tenet 7 Enola Holmes N 8 Harley Quinn: Birds of Prey 9 Mulan 10 Jojo Rabbit o w 8 Q4'19 Q1'20 Q2'20 Q3'20 $ in millions except per share data) Revenue Y/ % Growth Operating Income Operating Margin Net Income Diluted EPS 5,467 $ 30.6% 459 $ 8.4% 587 $ 1.30 $ $ 5,768 $ 27.6% 958 $ 16.6% 709 $ 1.57 $ 6,148 $ 24.9% 1,358 $ 22.1% 720 S 1.59 $ Q121 Q4'20 Forecast 6,644 $ 7,129 21.5% 23.6% 954 $ 1,780 14.4% 25.0% 542 $ 1,355 1.19 $ 2.97 6,436 $ 22.7% 1,315 $ 20.4% 790 $ 1.74 $ $ $ Global Streaming Paid Memberships Y/Y % Growth Global Streaming Paid Net Additions 167.09 20.0% 8.76 182.86 22.8% 15.77 192.95 27.3% 10.09 195.15 23.3% 2.20 203.66 21.9% 8.51 209.661 14.7% 6.00 Net cash provided by (used in) operating activities Free Cash Flow Shares (FD) $ $ (1,462) $ (1,670) $ 451.4 260 $ 162 $ 452.5 1,041 S 899 $ 1,264 $ 1,145 $ 455.1 (138) (284) 455.3 453.9 Note: Figures are consolidated, including DVD. *Free cash flow represents Net Cash provided by (used in) operating activities less purchases of property and equipment and change in other assets. Weekly Global Paid Net Adds Year to Date (M) 40M 2020 35M 30M 2018 2019 25M 2017 20M 15M 10M 5M OM 2021 (Q1'21 Forecast) Apr May Jun Jan Feb Mar Jul Aug Sep Oct Nov Dec Q4'19 Q120 Q2'20 Q3'20 Q4'20 $ (in millions) UCAN Streaming: Revenue Paid Memberships Paid Net Additions Average Revenue per Membership Y/ % Growth F/X Neutral Y/ % Growth 2,672 $ 67.66 0.55 13.22 $ 17% 17% 2,703 $ 69.97 2.31 13.09 $ 14% 14% 2,840 $ 72.90 2.94 13.25 $ 6% 6% 2,933 $ 73.08 0.18 13.40 $ 2% 3% 2,980 73.94 0.86 13.51 2% 2% $ $ $ EMEA: Revenue Paid Memberships Paid Net Additions Average Revenue per Membership YNY% Growth F/X Neutral Y/V % Growth 1,563 $ 51.78 4.42 10.51 $ 3% 7% 1,723 $ 58.73 6.96 10.40 $ 2% 4% 1,893 $ 61.48 2.75 10.50 $ 4% 8% 2,019 $ 62.24 0.76 10.88 $ 5% 3% 2,137 66.70 4.46 11.05 5% 0% $ $ $ LATAM: Revenue Paid Memberships Paid Net Additions Average Revenue per Membership Y/Y% Growth F/X Neutral YN % Growth 746 $ 31.42 2.04 8.18 $ 9% 793 $ 34.32 2.90 8.05 $ 3% 785 $ 36.07 1.75 7.44 $ -9% 789 $ 36.32 0.26 7.27 $ -16% 5% 789 37.54 1.21 7.12 - 13% 4% $ 18% 12% 13% $ $ APAC: Revenue Paid Memberships Paid Net Additions Average Revenue per Membership Y/% Growth F/X Neutral Y/V % Growth 418 $ 16.23 1.75 9.07 $ -1% 0% 484 $ 19.84 3.60 8.94 $ -5% -3% 569 $ 22.49 2.66 8.96 $ -4% 1% 635 $ 23.50 1.01 9.20 $ - 1% - 1% 685 25.49 1.99 9.32 3% 0% $ NH TV Shows 1 Tiger King N 2 Big Brother Brasil 3 Money Heist N 4 Cobra Kai N 5 The Umbrella Academy N 6 Emily in Paris N 7 Ozark N 8 The Queen's Gambit N 9 Outer Banks N 10 Locke & Key N Movies 1 Parasite 2 1917 3 Black Panther 4 365 Dni N 5 Contagion 6 Tenet 7 Enola Holmes N 8 Harley Quinn: Birds of Prey 9 Mulan 10 Jojo Rabbit o w 8 Q4'19 Q1'20 Q2'20 Q3'20 $ in millions except per share data) Revenue Y/ % Growth Operating Income Operating Margin Net Income Diluted EPS 5,467 $ 30.6% 459 $ 8.4% 587 $ 1.30 $ $ 5,768 $ 27.6% 958 $ 16.6% 709 $ 1.57 $ 6,148 $ 24.9% 1,358 $ 22.1% 720 S 1.59 $ Q121 Q4'20 Forecast 6,644 $ 7,129 21.5% 23.6% 954 $ 1,780 14.4% 25.0% 542 $ 1,355 1.19 $ 2.97 6,436 $ 22.7% 1,315 $ 20.4% 790 $ 1.74 $ $ $ Global Streaming Paid Memberships Y/Y % Growth Global Streaming Paid Net Additions 167.09 20.0% 8.76 182.86 22.8% 15.77 192.95 27.3% 10.09 195.15 23.3% 2.20 203.66 21.9% 8.51 209.661 14.7% 6.00 Net cash provided by (used in) operating activities Free Cash Flow Shares (FD) $ $ (1,462) $ (1,670) $ 451.4 260 $ 162 $ 452.5 1,041 S 899 $ 1,264 $ 1,145 $ 455.1 (138) (284) 455.3 453.9 Note: Figures are consolidated, including DVD. *Free cash flow represents Net Cash provided by (used in) operating activities less purchases of property and equipment and change in other assets. Weekly Global Paid Net Adds Year to Date (M) 40M 2020 35M 30M 2018 2019 25M 2017 20M 15M 10M 5M OM 2021 (Q1'21 Forecast) Apr May Jun Jan Feb Mar Jul Aug Sep Oct Nov DecStep by Step Solution
There are 3 Steps involved in it
Step: 1

Get Instant Access to Expert-Tailored Solutions
See step-by-step solutions with expert insights and AI powered tools for academic success
Step: 2

Step: 3

Ace Your Homework with AI
Get the answers you need in no time with our AI-driven, step-by-step assistance
Get Started


