Financial Statement Analysis Section For this section you will be using Chapter 14 as a guide and you will also rely on previous chapters in Acct& 201 and 202. Show all percentages and decimal computations to the nearest 10th (example: percentage = 18.3%, decimal = .2) Be sure to provide adequate written explanation where requested. Being too brief is a common place to lose points. Be sure to show your work for all calculations and CIRCLE ALL FINAL ANSWERS, especially the ratios! You can access Starbucks annual report for 2019 by following the directions in #3 of this section of the test. You will want to print the financial statements but dont print anything else because the report is very long, especially the notes. 1. Prepare common size Income Statements and Balance Sheets for Starbucks for 2019 and 2018 using vertical analysis as shown in Chapter 14. For the Income Statement, use Total Net Revenues as the base. You should include all items shown on Starbucks Statement of Income and Balance Sheet (dont condense Current Assets into one number; show each Current Asset separately). Comment on why vertical analysis and common size statements are useful for analyzing the performance of a company and give two or three specific examples from your Starbucks computations.
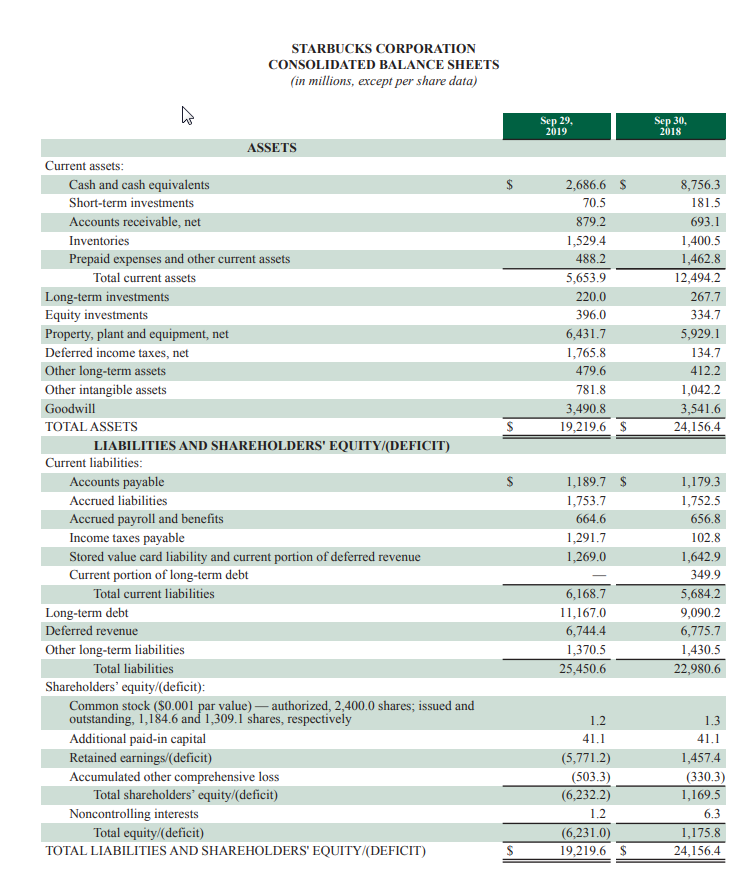
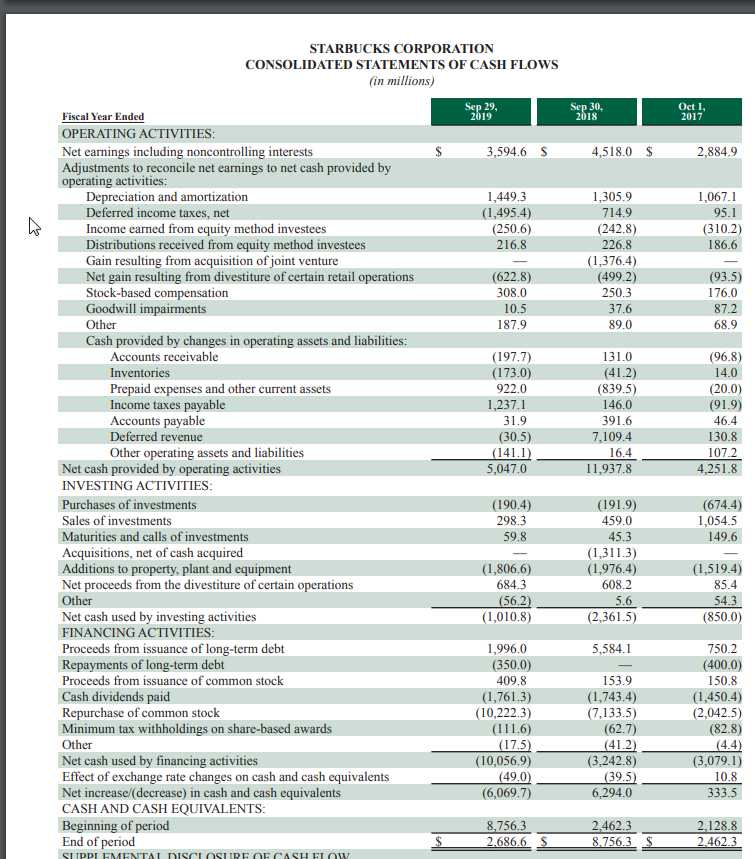
STARBUCKS CORPORATION CONSOLIDATED BALANCE SHEETS (in millions, except per share data) Sep 29, 2019 Sep 30, 2018 $ 2,686.6 70.5 879.2 1,529.4 488.2 5,653.9 220.0 396.0 6,431.7 1,765.8 479.6 781.8 3,490.8 19,219.6 8,756.3 181.5 693.1 1,400.5 1,462.8 12,494.2 267.7 334.7 5,929.1 134.7 412.2 1,042.2 3,541.6 24,156.4 $ $ $ $ ASSETS Current assets: Cash and cash equivalents Short-term investments Accounts receivable, net Inventories Prepaid expenses and other current assets Total current assets Long-term investments Equity investments Property, plant and equipment, net Deferred income taxes, net Other long-term assets Other intangible assets Goodwill TOTAL ASSETS LIABILITIES AND SHAREHOLDERS' EQUITY/DEFICIT) Current liabilities: Accounts payable Accrued liabilities Accrued payroll and benefits Income taxes payable Stored value card liability and current portion of deferred revenue Current portion of long-term debt Total current liabilities Long-term debt Deferred revenue Other long-term liabilities Total liabilities Shareholders' equity/(deficit): Common stock ($0.001 par value) - authorized, 2,400.0 shares; issued and outstanding, 1,184.6 and 1,309.1 shares, respectively Additional paid-in capital Retained earnings (deficit) Accumulated other comprehensive loss Total shareholders' equity/(deficit) Noncontrolling interests Total equity/(deficit) TOTAL LIABILITIES AND SHAREHOLDERS' EQUITY/(DEFICIT) 1,189.7 1,753.7 664.6 1,291.7 1,269.0 1,179.3 1,752.5 656.8 102.8 1,642.9 349.9 5,684.2 9,090.2 6,775.7 1,430.5 22,980.6 6,168.7 11,167.0 6,744.4 1,370.5 25,450.6 1.2 41.1 (5,771.2) (503.3) (6,232.2) 1.3 41.1 1,457.4 (330.3) 1,169.5 1.2 6.3 (6,231.0) 19,219.6 1,175.8 24,156.4 S $ STARBUCKS CORPORATION CONSOLIDATED STATEMENTS OF CASH FLOWS in millions) $ 3,594.6 $ 4,518.0 $ 2,884.9 1,449.3 (1,495.4) (250.6) 216.8 1,067.1 95.1 (310.2) 186.6 1,305.9 714.9 (242.8) 226.8 (1,376.4) (499.2) 250.3 37.6 89.0 (622.8) 308.0 10.5 187.9 (93.5) 176.0 87.2 68.9 (197.7) (173.0) 922.0 1,237.1 31.9 (30.5) (141.1) 5,047.0 131.0 (41.2) (839.5) 146.0 391.6 7,109.4 16.4 11,937.8 (96.8) 14.0 (20.0) (91.9) 46.4 130.8 107.2 4,251.8 Fiscal Year Ended OPERATING ACTIVITIES: Net earnings including noncontrolling interests Adjustments to reconcile net earnings to net cash provided by operating activities: Depreciation and amortization Deferred income taxes, net Income earned from equity method investees Distributions received from equity method investees Gain resulting from acquisition of joint venture Net gain resulting from divestiture of certain retail operations Stock-based compensation Goodwill impairments Other Cash provided by changes in operating assets and liabilities: Accounts receivable Inventories Prepaid expenses and other current assets Income taxes payable Accounts payable Deferred revenue Other operating assets and liabilities Net cash provided by operating activities INVESTING ACTIVITIES: Purchases of investments Sales of investments Maturities and calls of investments Acquisitions, net of cash acquired Additions to property, plant and equipment Net proceeds from the divestiture of certain operations Other Net cash used by investing activities FINANCING ACTIVITIES: Proceeds from issuance of long-term debt Repayments of long-term debt Proceeds from issuance of common stock Cash dividends paid Repurchase of common stock Minimum tax withholdings on share-based awards Other Net cash used by financing activities Effect of exchange rate changes on cash and cash equivalents Net increase/(decrease) in cash and cash equivalents CASH AND CASH EQUIVALENTS: Beginning of period End of period SUPPLEMENTAT DISCLOSURE OF CASH FLOW (190.4) 298.3 59.8 (674.4) 1,054.5 149.6 (191.9) 459.0 45.3 (1,311.3) (1,976.4) 608.2 (1,519.4) 85.4 (1,806.6) 684.3 (56.2) (1,010.8) 5.6 54.3 (2,361.5) (850.0) 5,584.1 1,996.0 (350.0) 409.8 (1,761.3) (10,222.3) (111.6) (17.5) (10,056.9) (49.0) (6,069.7) 153.9 (1,743.4) (7,133.5) (62.7) (41.2) (3,242.8) (39.5) 6,294.0 750.2 (400.0) 150.8 (1,450.4) (2,042.5) (82.8) (4.4) (3,079.1) 10.8 333.5 $ 8,756.3 2.686,6 S 2.462.3 8.756.3 $ 2.128.8 2.462.3 STARBUCKS CORPORATION CONSOLIDATED BALANCE SHEETS (in millions, except per share data) Sep 29, 2019 Sep 30, 2018 $ 2,686.6 70.5 879.2 1,529.4 488.2 5,653.9 220.0 396.0 6,431.7 1,765.8 479.6 781.8 3,490.8 19,219.6 8,756.3 181.5 693.1 1,400.5 1,462.8 12,494.2 267.7 334.7 5,929.1 134.7 412.2 1,042.2 3,541.6 24,156.4 $ $ $ $ ASSETS Current assets: Cash and cash equivalents Short-term investments Accounts receivable, net Inventories Prepaid expenses and other current assets Total current assets Long-term investments Equity investments Property, plant and equipment, net Deferred income taxes, net Other long-term assets Other intangible assets Goodwill TOTAL ASSETS LIABILITIES AND SHAREHOLDERS' EQUITY/DEFICIT) Current liabilities: Accounts payable Accrued liabilities Accrued payroll and benefits Income taxes payable Stored value card liability and current portion of deferred revenue Current portion of long-term debt Total current liabilities Long-term debt Deferred revenue Other long-term liabilities Total liabilities Shareholders' equity/(deficit): Common stock ($0.001 par value) - authorized, 2,400.0 shares; issued and outstanding, 1,184.6 and 1,309.1 shares, respectively Additional paid-in capital Retained earnings (deficit) Accumulated other comprehensive loss Total shareholders' equity/(deficit) Noncontrolling interests Total equity/(deficit) TOTAL LIABILITIES AND SHAREHOLDERS' EQUITY/(DEFICIT) 1,189.7 1,753.7 664.6 1,291.7 1,269.0 1,179.3 1,752.5 656.8 102.8 1,642.9 349.9 5,684.2 9,090.2 6,775.7 1,430.5 22,980.6 6,168.7 11,167.0 6,744.4 1,370.5 25,450.6 1.2 41.1 (5,771.2) (503.3) (6,232.2) 1.3 41.1 1,457.4 (330.3) 1,169.5 1.2 6.3 (6,231.0) 19,219.6 1,175.8 24,156.4 S $ STARBUCKS CORPORATION CONSOLIDATED STATEMENTS OF CASH FLOWS in millions) $ 3,594.6 $ 4,518.0 $ 2,884.9 1,449.3 (1,495.4) (250.6) 216.8 1,067.1 95.1 (310.2) 186.6 1,305.9 714.9 (242.8) 226.8 (1,376.4) (499.2) 250.3 37.6 89.0 (622.8) 308.0 10.5 187.9 (93.5) 176.0 87.2 68.9 (197.7) (173.0) 922.0 1,237.1 31.9 (30.5) (141.1) 5,047.0 131.0 (41.2) (839.5) 146.0 391.6 7,109.4 16.4 11,937.8 (96.8) 14.0 (20.0) (91.9) 46.4 130.8 107.2 4,251.8 Fiscal Year Ended OPERATING ACTIVITIES: Net earnings including noncontrolling interests Adjustments to reconcile net earnings to net cash provided by operating activities: Depreciation and amortization Deferred income taxes, net Income earned from equity method investees Distributions received from equity method investees Gain resulting from acquisition of joint venture Net gain resulting from divestiture of certain retail operations Stock-based compensation Goodwill impairments Other Cash provided by changes in operating assets and liabilities: Accounts receivable Inventories Prepaid expenses and other current assets Income taxes payable Accounts payable Deferred revenue Other operating assets and liabilities Net cash provided by operating activities INVESTING ACTIVITIES: Purchases of investments Sales of investments Maturities and calls of investments Acquisitions, net of cash acquired Additions to property, plant and equipment Net proceeds from the divestiture of certain operations Other Net cash used by investing activities FINANCING ACTIVITIES: Proceeds from issuance of long-term debt Repayments of long-term debt Proceeds from issuance of common stock Cash dividends paid Repurchase of common stock Minimum tax withholdings on share-based awards Other Net cash used by financing activities Effect of exchange rate changes on cash and cash equivalents Net increase/(decrease) in cash and cash equivalents CASH AND CASH EQUIVALENTS: Beginning of period End of period SUPPLEMENTAT DISCLOSURE OF CASH FLOW (190.4) 298.3 59.8 (674.4) 1,054.5 149.6 (191.9) 459.0 45.3 (1,311.3) (1,976.4) 608.2 (1,519.4) 85.4 (1,806.6) 684.3 (56.2) (1,010.8) 5.6 54.3 (2,361.5) (850.0) 5,584.1 1,996.0 (350.0) 409.8 (1,761.3) (10,222.3) (111.6) (17.5) (10,056.9) (49.0) (6,069.7) 153.9 (1,743.4) (7,133.5) (62.7) (41.2) (3,242.8) (39.5) 6,294.0 750.2 (400.0) 150.8 (1,450.4) (2,042.5) (82.8) (4.4) (3,079.1) 10.8 333.5 $ 8,756.3 2.686,6 S 2.462.3 8.756.3 $ 2.128.8 2.462.3