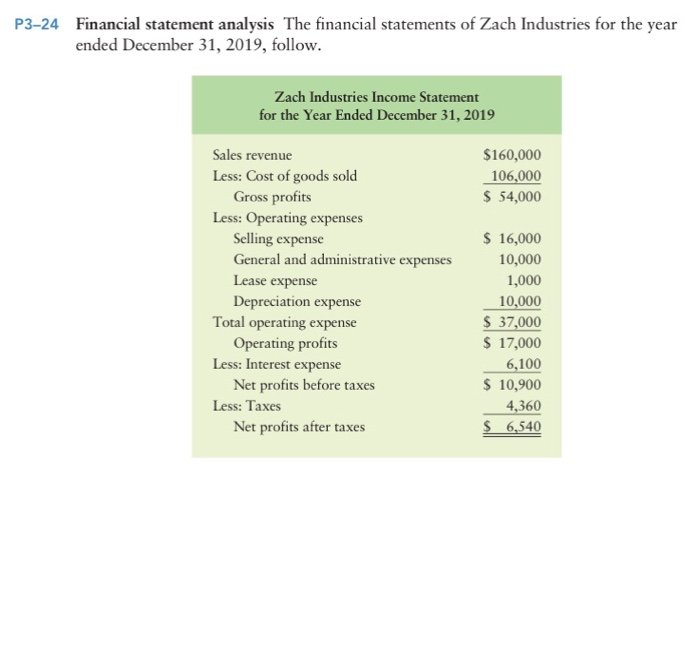
Financial statement analysis The financial statements of Zach Industries for the year ended December 31, 2019, follow P3-24 Zach Industries Income Statement for the Year Ended December 31, 2019 $160,000 106,000 S 54,000 Sales revenue Less: Cost of goods sold Gross profits Less: Operating expenses 16,000 10,000 1,000 10,000 S 37,000 S 17,000 6,100 S 10,900 4,360 $ 6,540 Selling expense General and administrative expenses Lease expense Depreciation expense Total operating expense Less: Interest expense Less: Taxes Operating profits Net profits before taxes Net profits after taxes 137 CHAPTER 3 Financial Statements and Ratio Analysis Zach Industries Balance Sheet December 31, 2019 Cash Marketable securities Accounts receivable $ 500 25,000 Total current assets Land Buildings and equipment Less: Accumulated depreciation S 26,000 Net fixed assets Total assets Liabilities and Stockholders Equity Accounts payable Notes payable s 22,000 S 69,000 22,950 Total current liabilities Long-term debt Common stock Retained earnings Total liabilities and stockholders' equity $150,000 The firm's 3,000 outstanding shares of common stock closed 2019 at a price of $25 per share. a. Use the preceding financial statements to complete the following table. Assume that the industry averages given in 2018 and 2019 the table are applicable for both Industry average Actual 2018 Actual 2019 1.80 0.70 2.50 1.84 0.78 2.59 Current ratio Quick ratio Inventory turnover Average collection period Debt ratio Times interest earned ratio Gross profit margin Net profit margin Return on total assets Return on common equity Market/book ratio 37.5 days 65% 36.5 days 3.8 38% 3.6% 9.5% 1.2 Based on a 365-day year and on end-of-year figures b. Analyze Zach Industries' financial condition as it is related to (1) liquidity, (2) activity, (3) debt, (4) profitability, and (5) market. Summarize the company's overall financial condition