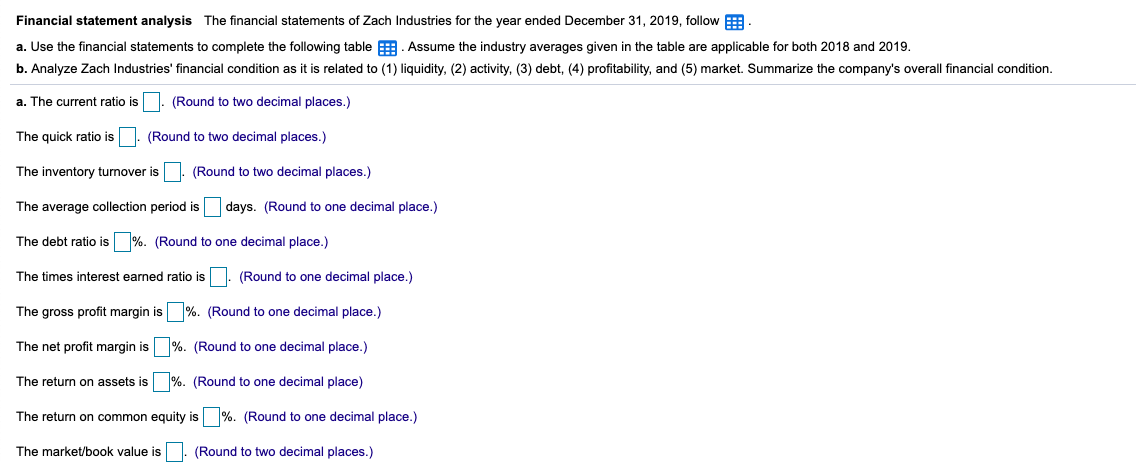
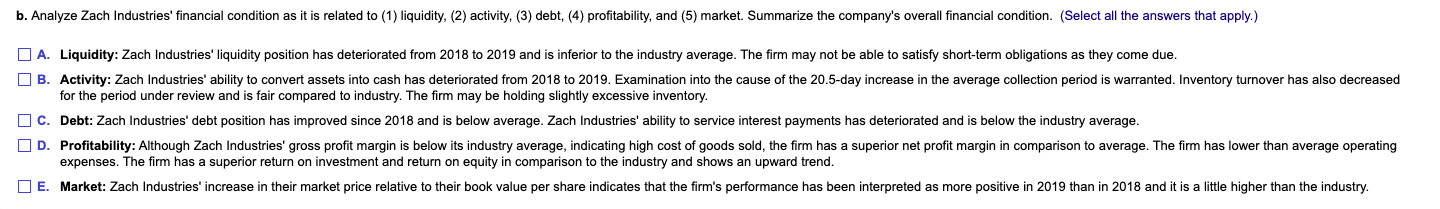
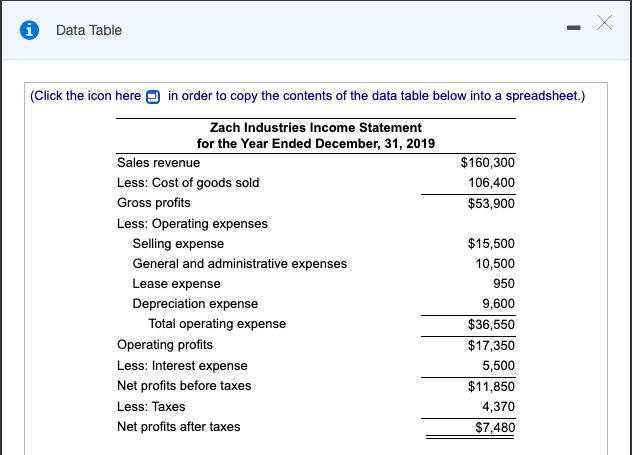
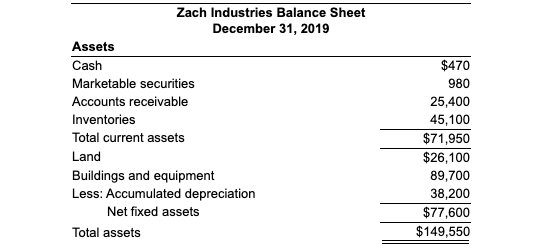
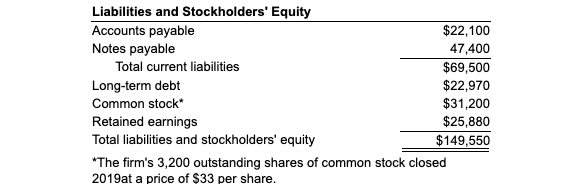
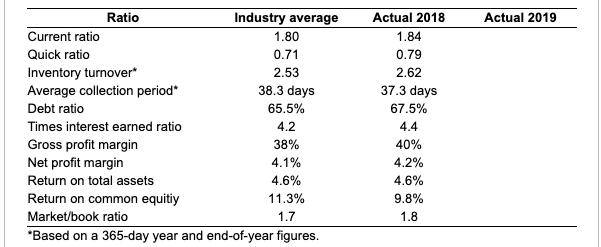
Financial statement analysis The financial statements of Zach Industries for the year ended December 31, 2019, follow : a. Use the financial statements to complete the following table : Assume the industry averages given in the table are applicable for both 2018 and 2019. b. Analyze Zach Industries' financial condition as it is related to (1) liquidity, (2) activity, (3) debt, (4) profitability, and (5) market. Summarize the company's overall financial condition. a. The current ratio is (Round to two decimal places.) The quick ratio is (Round to two decimal places.) The inventory turnover is (Round to two decimal places.) The average collection period is days. (Round to one decimal place.) The debt ratio is %. (Round to one decimal place.) The times interest earned ratio is . (Round to one decimal place.) The gross profit margin is%. (Round to one decimal place.) The net profit margin is %. (Round to one decimal place.) The return on assets is %. (Round to one decimal place) The return on common equity is %. (Round to one decimal place.) The market/book value is (Round to two decimal places.) b. Analyze Zach Industries' financial condition as it is related to (1) liquidity, (2) activity, (3) debt, (4) profitability, and (5) market. Summarize the company's overall financial condition. (Select all the answers that apply.) A. Liquidity: Zach Industries' liquidity position has deteriorated from 2018 to 2019 and is inferior to the industry average. The firm may not be able to satisfy short-term obligations as they come due. B. Activity: Zach Industries' ability to convert assets into cash has deteriorated from 2018 to 2019. Examination into the cause of the 20.5-day increase in the average collection period is warranted. Inventory turnover has also decreased for the period under review and is fair compared to industry. The firm may be holding slightly excessive inventory. C. Debt: Zach Industries' debt position has improved since 2018 and is below average. Zach Industries' ability to service interest payments has deteriorated and is below the industry average. D. Profitability: Although Zach Industries' gross profit margin is below its industry average, indicating high cost of goods sold, the firm has superior net profit margin in comparison to average. The firm has lower than average operating expenses. The firm has a superior return on investment and return on equity in comparison to the industry and shows an upward trend. E. Market: Zach Industries' increase in their market price relative to their book value per share indicates that the firm's performance has been interpreted as more positive in 2019 than in 2018 and it is a little higher than the industry. 1 Data Table X (Click the icon here in order to copy the contents of the data table below into a spreadsheet.) Zach Industries Income Statement for the Year Ended December, 31, 2019 Sales revenue $160,300 Less: Cost of goods sold 106,400 Gross profits $53,900 Less: Operating expenses Selling expense $15,500 General and administrative expenses 10,500 Lease expense 950 Depreciation expense 9,600 Total operating expense $36,550 Operating profits $17,350 Less: Interest expense 5,500 Net profits before taxes $11,850 Less: Taxes 4,370 Net profits after taxes $7,480 Zach Industries Balance Sheet December 31, 2019 Assets Cash Marketable securities Accounts receivable Inventories Total current assets Land Buildings and equipment Less: Accumulated depreciation Net fixed assets Total assets $470 980 25,400 45,100 $71,950 $26,100 89,700 38,200 $77,600 $149,550 Liabilities and Stockholders' Equity Accounts payable $22,100 Notes payable 47,400 Total current liabilities $69,500 Long-term debt $22,970 Common stock $31,200 Retained earnings $25,880 Total liabilities and stockholders' equity $149,550 *The firm's 3,200 outstanding shares of common stock closed 2019at a price of $33 per share. Actual 2019 Ratio Industry average Current ratio 1.80 Quick ratio 0.71 Inventory turnover* 2.53 Average collection period 38.3 days Debt ratio 65.5% Times interest earned ratio 4.2 Gross profit margin 38% Net profit margin 4.1% Return on total assets 4.6% Return on common equitiy 11.3% Market/book ratio *Based on a 365-day year and end-of-year figures. Actual 2018 1.84 0.79 2.62 37.3 days 67.5% 4.4 40% 4.2% 4.6% 9.8% 1.8 1.7