Answered step by step
Verified Expert Solution
Link Copied!

Question

1 Approved Answer

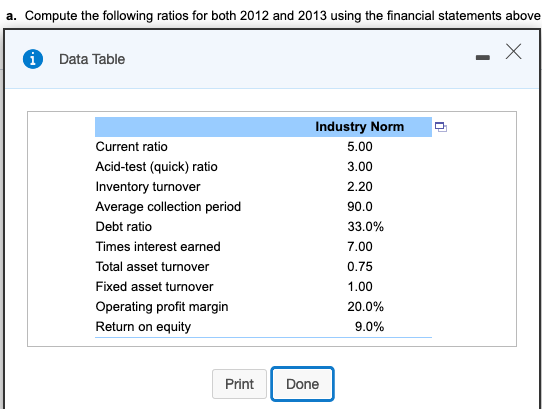
(Financial statement analysis) Using the following financial statements for Pamplin, Inc: :: a. Compute the following ratios for both 2012 and 2013 using the financial

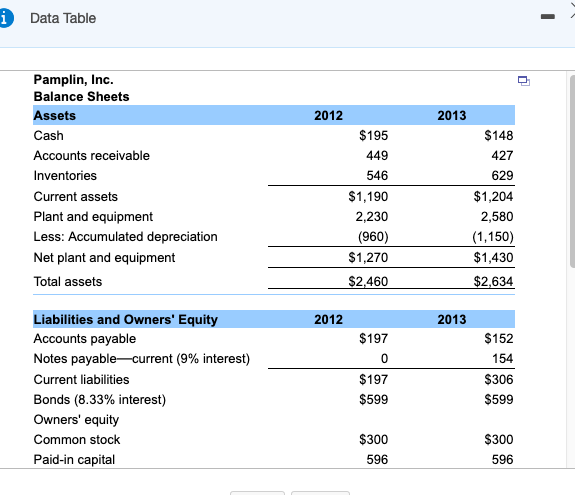
image text in transcribedimage text in transcribedimage text in transcribedimage text in transcribed

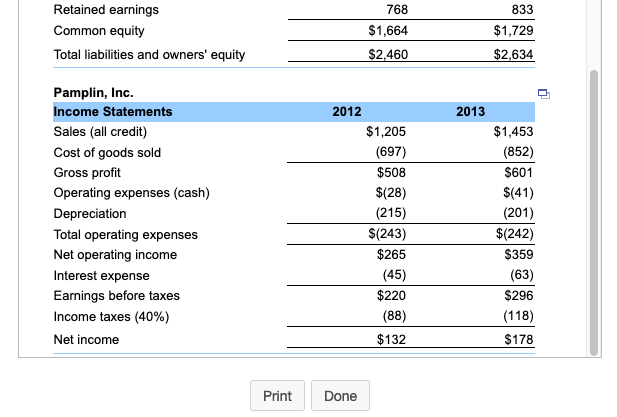
(Financial statement analysis) Using the following financial statements for Pamplin, Inc: :: a. Compute the following ratios for both 2012 and 2013 using the financial statements above: b. Compare Pamplin's financial ratios to the industry norms listed above and assess each of the following attributes of the firm's financial condition: liquidity, capital structure, asset management efficiency, and profitability. i Data Table 2012 Pamplin, Inc. Balance Sheets Assets Cash Accounts receivable Inventories Current assets Plant and equipment Less: Accumulated depreciation Net plant and equipment Total assets $195 449 546 $1,190 2,230 (960) $1,270 $2,460 2013 $148 427 629 $1,204 2,580 (1,150) $1,430 $2,634 2012 2013 $197 0 Liabilities and Owners' Equity Accounts payable Notes payable current (9% interest) Current liabilities Bonds (8.33% interest) Owners' equity Common stock Paid-in capital $152 154 $306 $599 $197 $599 $300 596 $300 596 Retained earnings Common equity Total liabilities and owners' equity 768 $1,664 $2,460 833 $1,729 $2,634 2013 Pamplin, Inc. Income Statements Sales (all credit) Cost of goods sold Gross profit Operating expenses (cash) Depreciation Total operating expenses Net operating income Interest expense Earnings before taxes Income taxes (40%) Net income 2012 $1,205 (697) $508 $(28) (215) $(243) $265 (45) $220 (88) $132 $1,453 (852) $601 $(41) (201) $(242) $359 (63) $296 (118) $178 Print Done a. Compute the following ratios for both 2012 and 2013 using the financial statements above A Data Table . Current ratio Acid-test (quick) ratio Inventory turnover Average collection period Debt ratio Times interest earned Total asset turnover Fixed asset turnover Operating profit margin Return on equity Industry Norm 5.00 3.00 2.20 90.0 33.0% 7.00 0.75 1.00 20.0% 9.0% Print Print Done Done
Step by Step Solution

There are 3 Steps involved in it

Step: 1

blur-text-image

Get Instant Access to Expert-Tailored Solutions

See step-by-step solutions with expert insights and AI powered tools for academic success

Step: 2

blur-text-image_2

Step: 3

blur-text-image_3

Ace Your Homework with AI

Get the answers you need in no time with our AI-driven, step-by-step assistance

Get Started

Recommended Textbook for

Introduction To Finance Markets, Investments, And Financial Management

Authors: Ronald W Melicher, Edgar Norton

13th Edition

0470128925, 9780470128923

More Books

Students also viewed these Finance questions

Question

1. What are the main steps in the text mining process?

Answered: 1 week ago