Financial Statement Analysis/Project
After Analyzing the years 2017/2018/2019 for your bank(Societe Generale De Banque- Jordanie) . Please answer the following questions
Part One:
Required:
Name of Audit Company including the type of Audit Report, for the three years, discuss briefly.
Part Two:
Required:
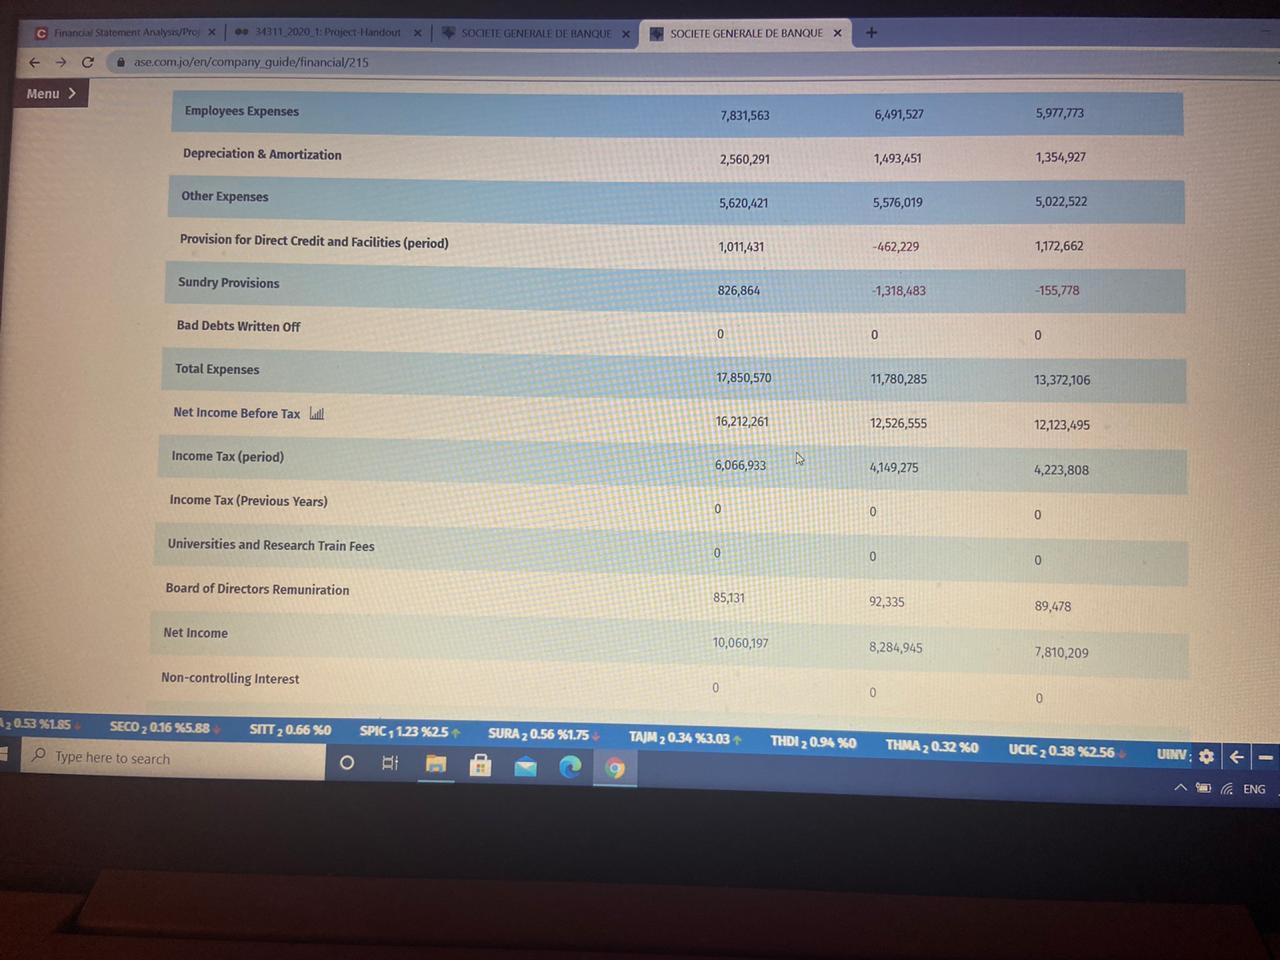
| a. | Prepare a vertical common-size analysis of banks income statement for each year, using Interest income as the base. |
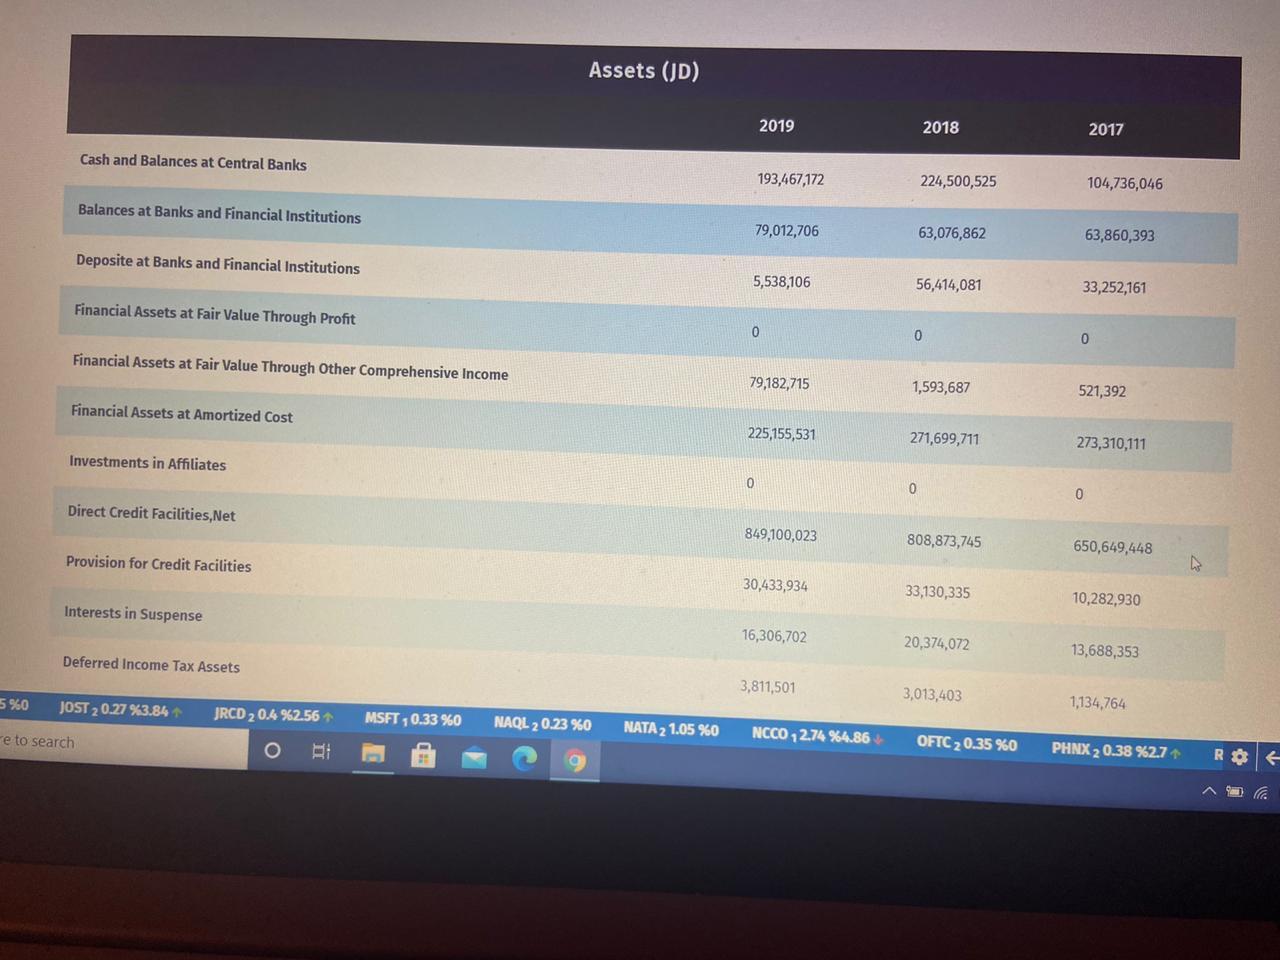
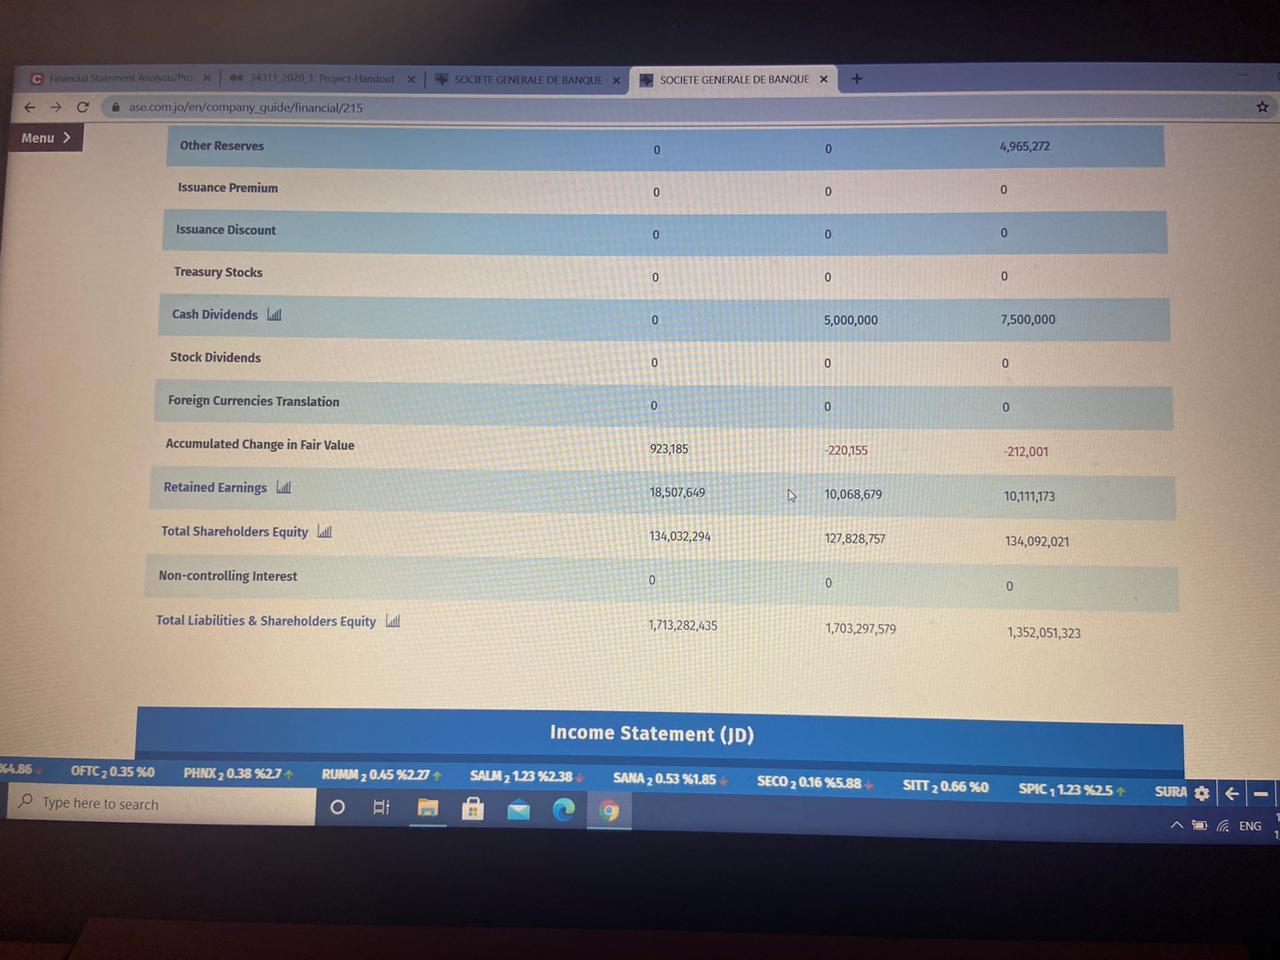
| b. | Prepare a vertical analysis of banks statement of financial position for each year, using the Totals of each section as the base.(Total assets/Total Liabilities/ Total owners equity) |
| c. | Comment briefly on the changes between the two years, based on the vertical common-size statement. |
Part Three:
Required:
| a. | Using 2017 as the base year, perform a horizontal analysis, for your Income statement. |
| b. | Using 2017 as the base year, perform a horizontal analysis, for your Statement of financial position. |
c. Comment on the results of the horizontal analysis.
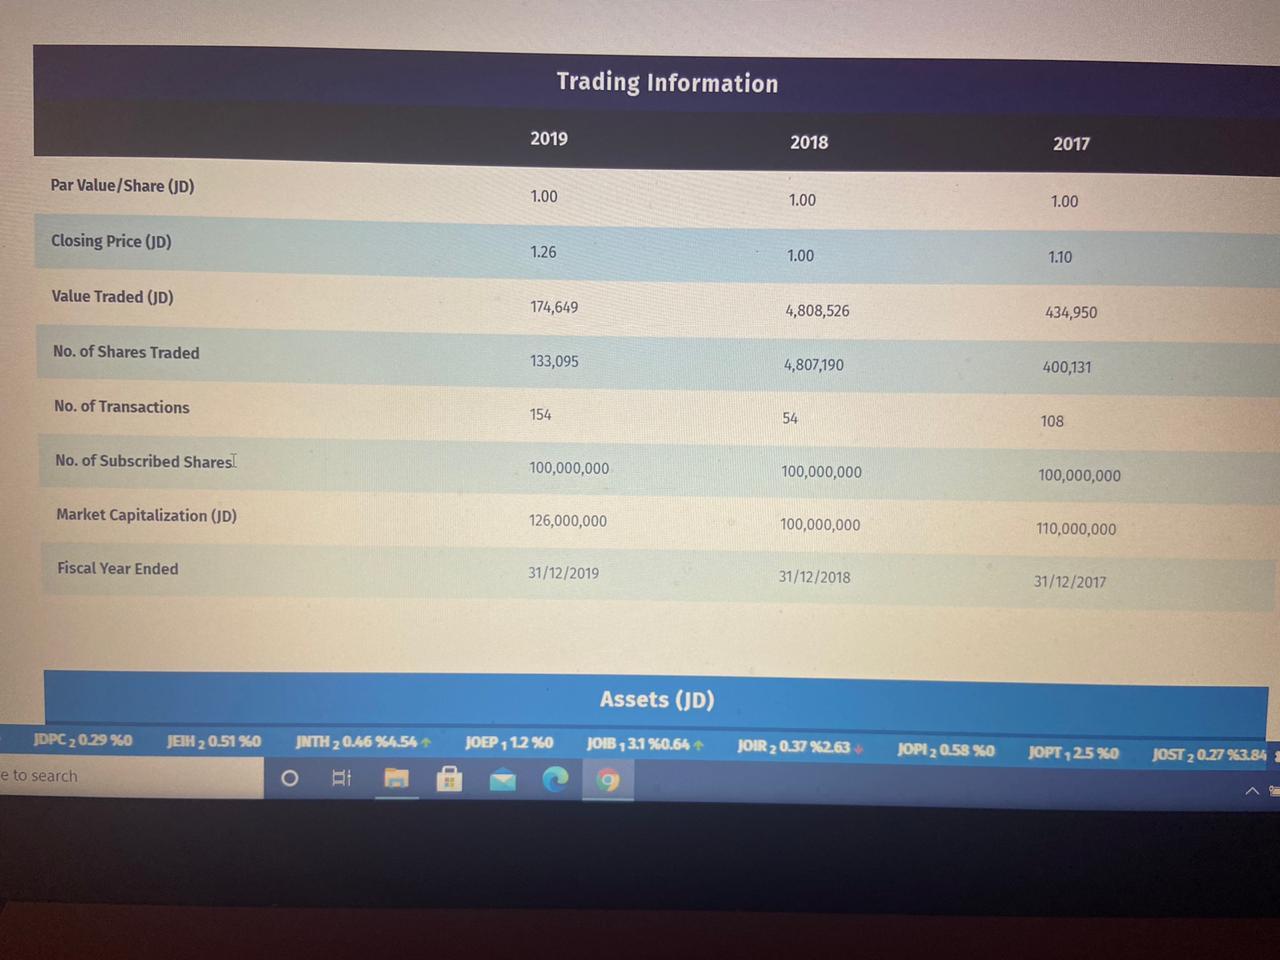
Part Four: Calculate the following ratios and analyze your results for the years 2017/2018/2019 (replacing net sales with net interest income is desired)
Liquidity Ratios
- Account Receivable Turnover
- Working Capital
- Current Ratio
- Acid-Test Ratio
- Cash Ratio
- Interest Revenue to Working Capital
Profitability Ratios
- Return on Assets
- Return on Equity
- Return on Investment
- Return on Common Equity
Investor and Market Ratios
- Earnings Per Share
- Book Value per Share
- Earning Yield (EPS/MARKETVALUE)
- Price-to-Book Ratio (Earnings Per Share/Book value Per Share)
Activity Ratios
- Investment to deposit ratio. (INVESTMENTS/DEPOSITS)
- Resource Utilization ratio. (INVESTMENTS/(DEPOSITS + OWNERS EQUITY)
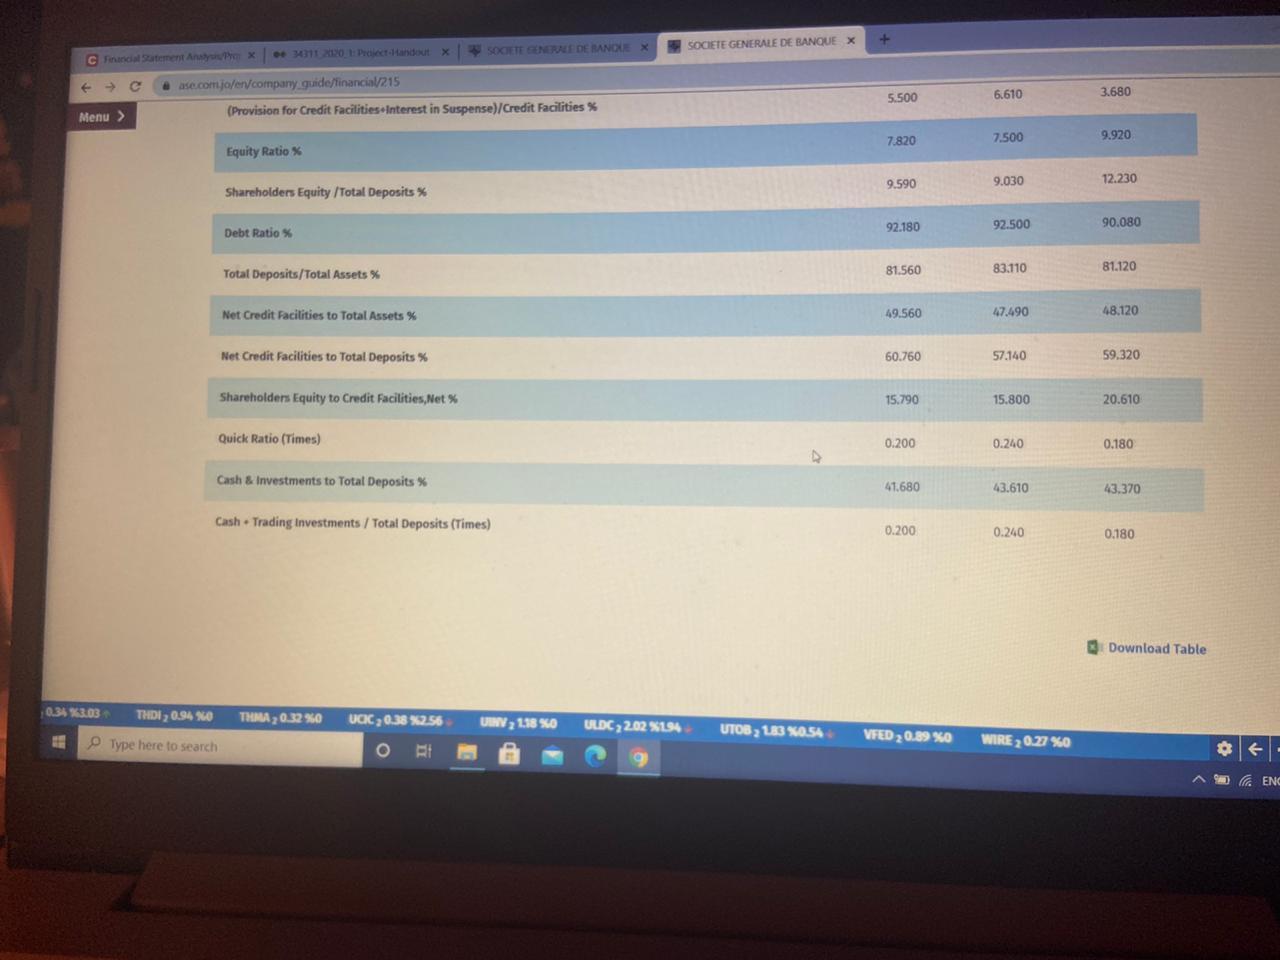
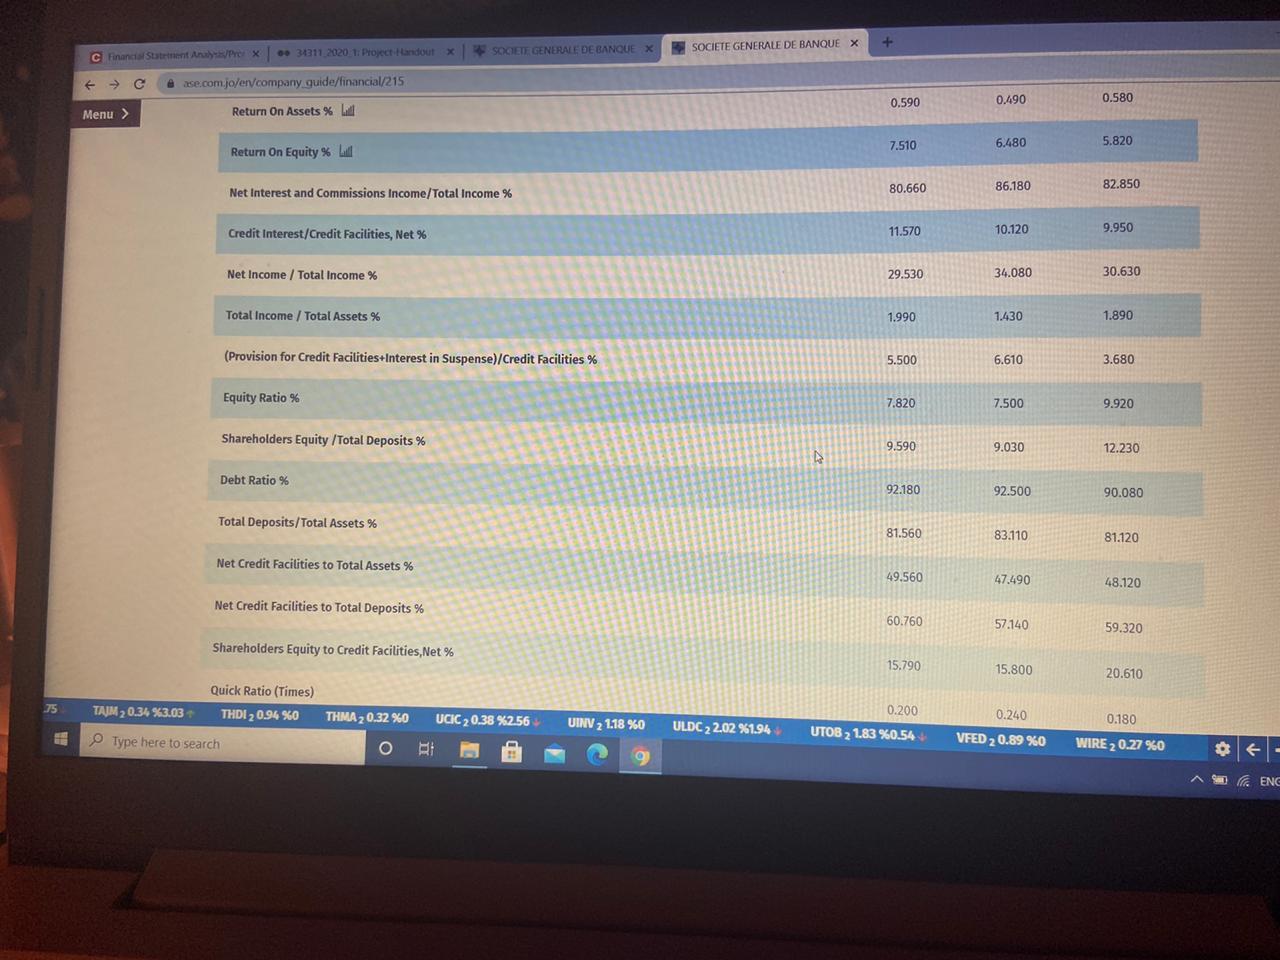
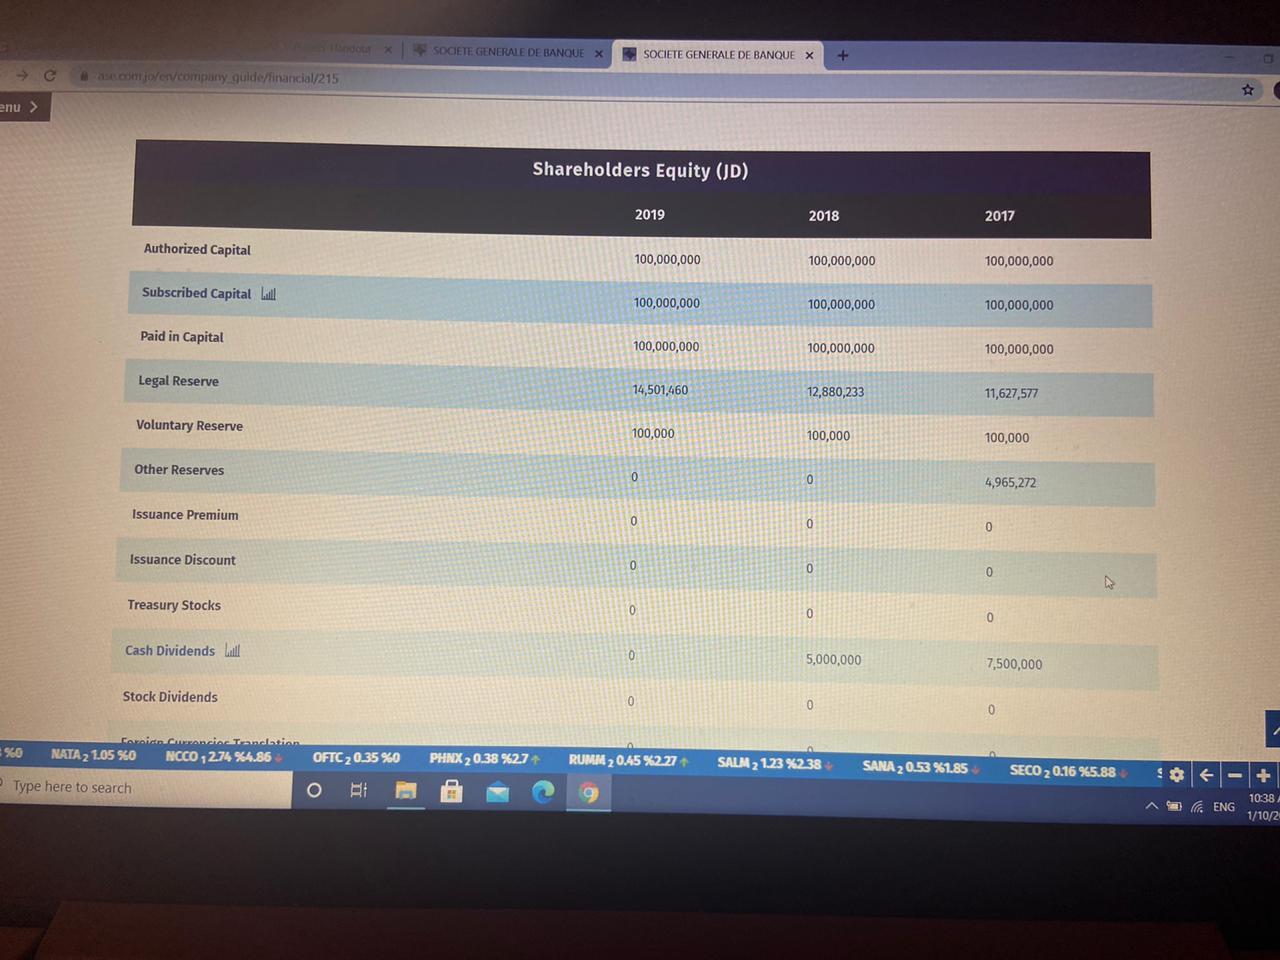
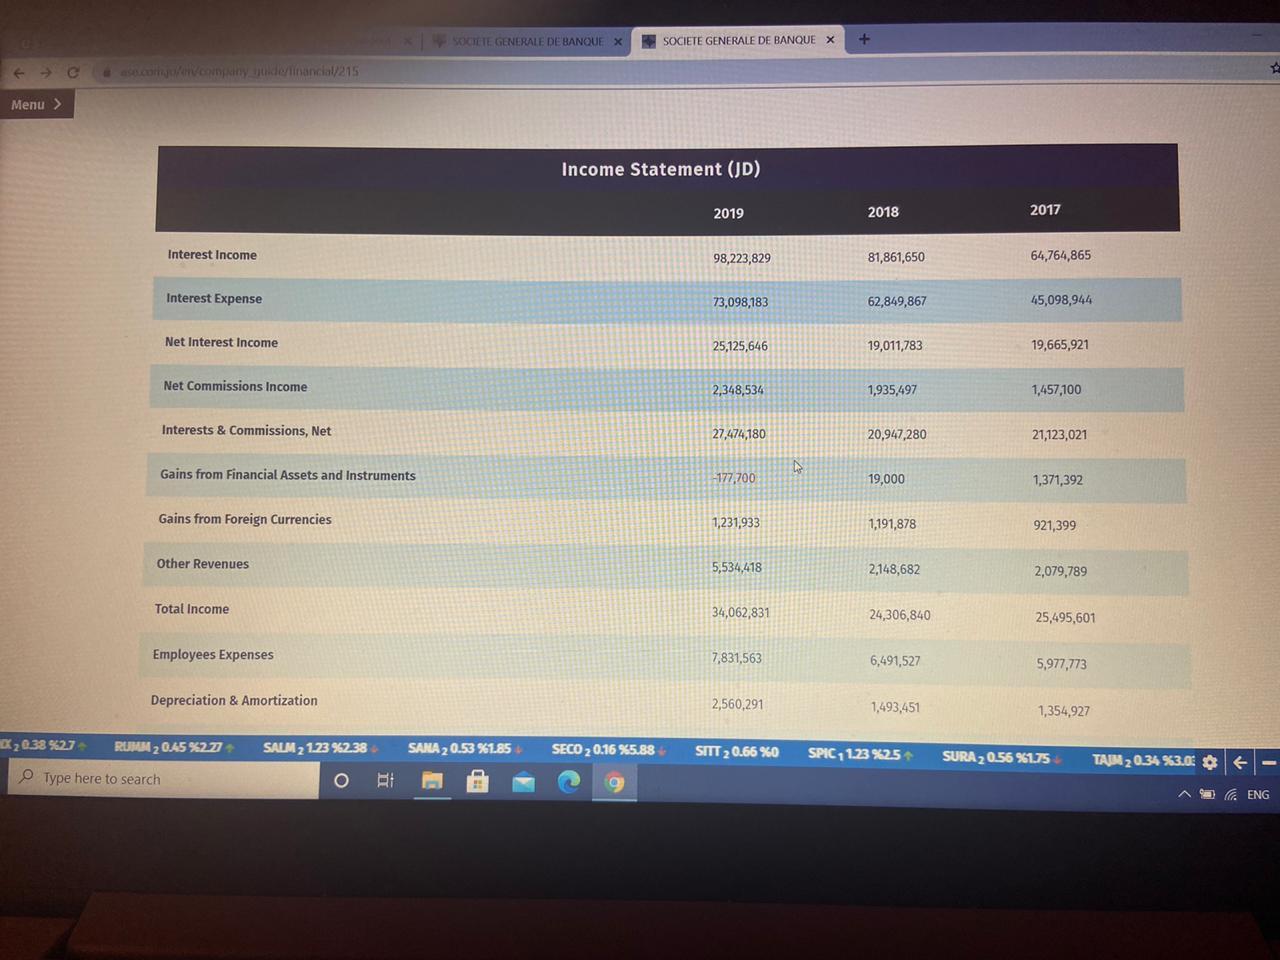
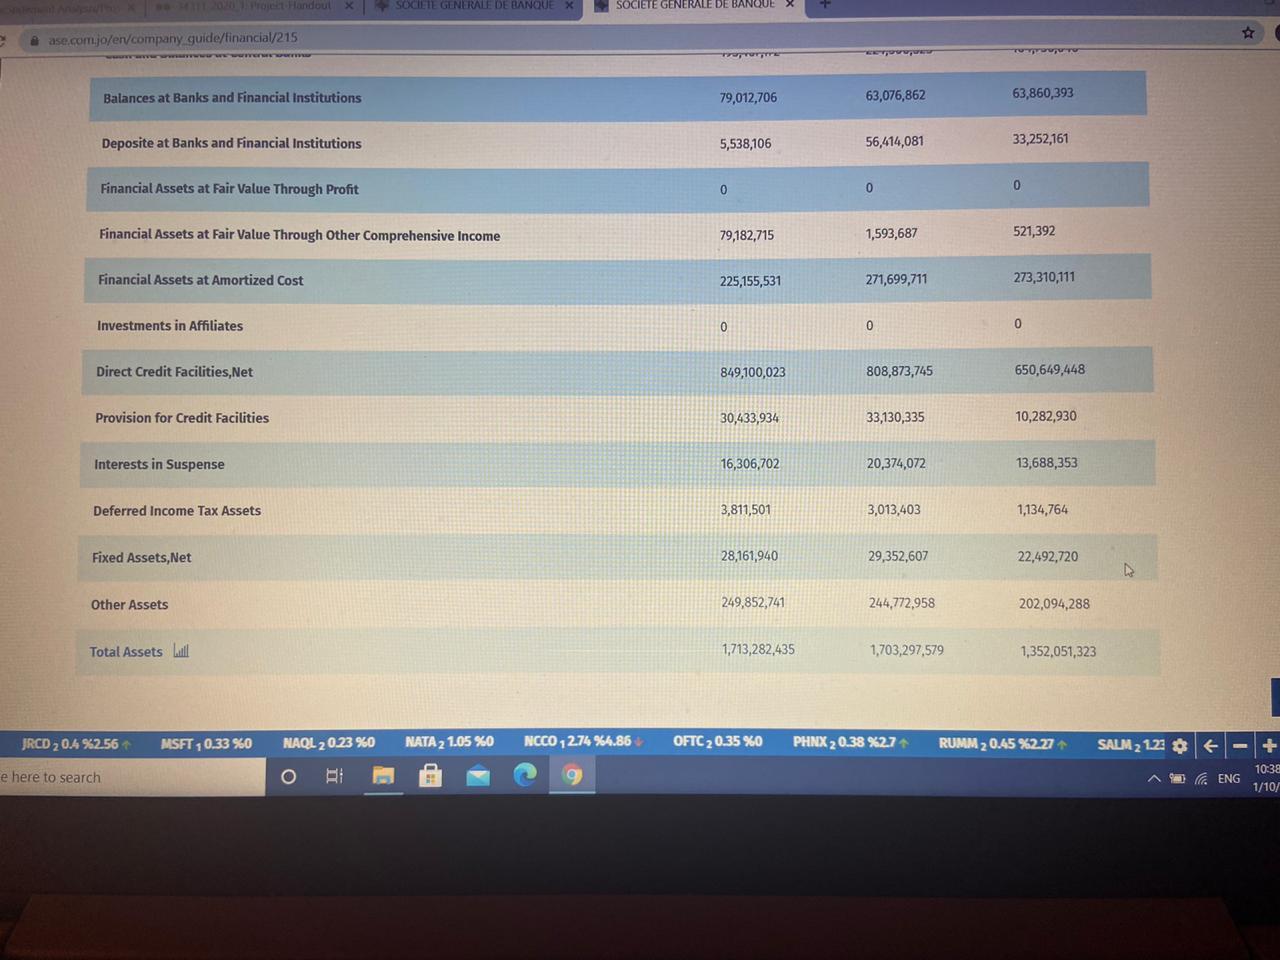
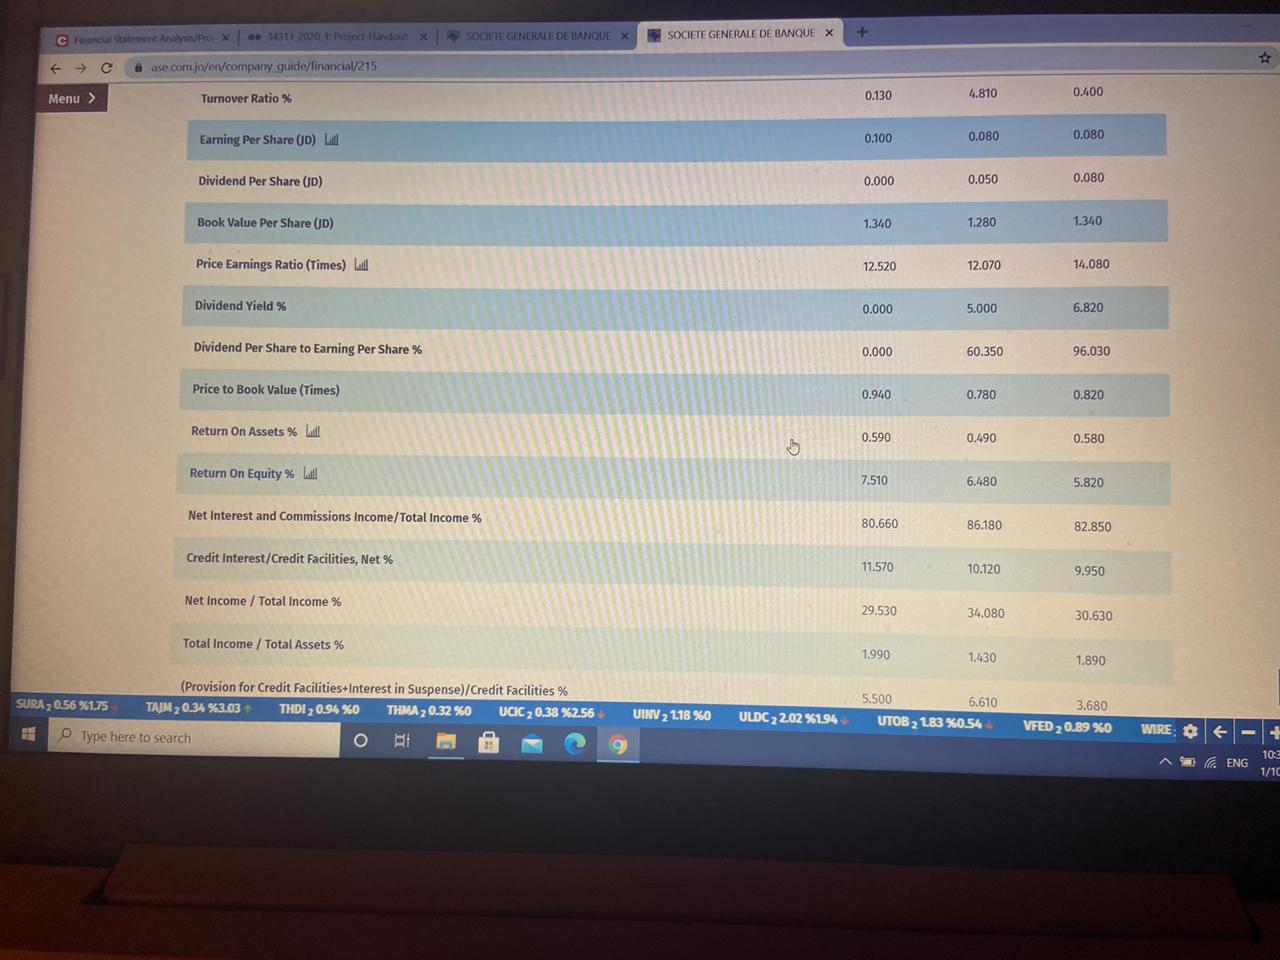
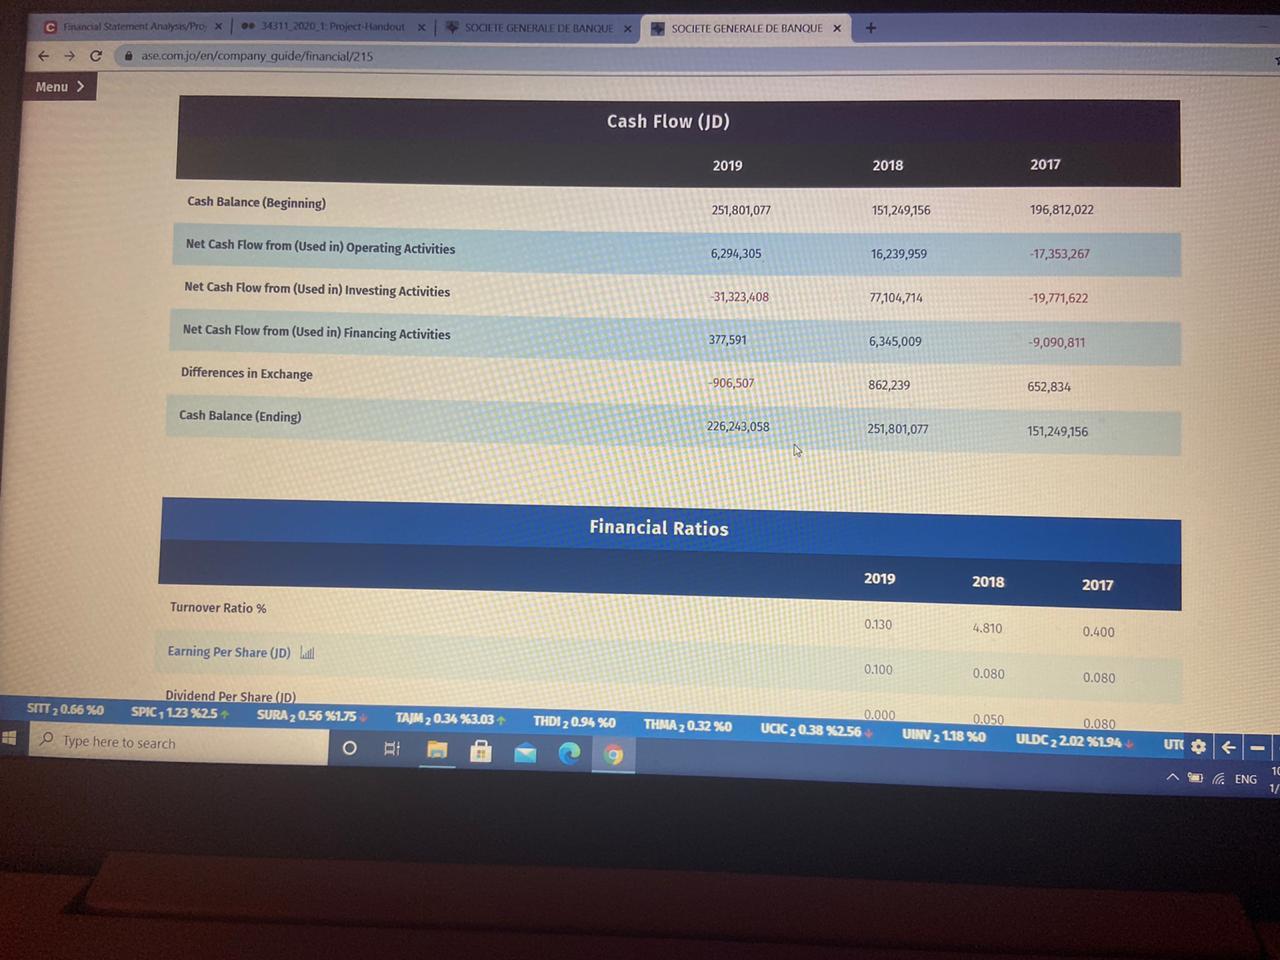
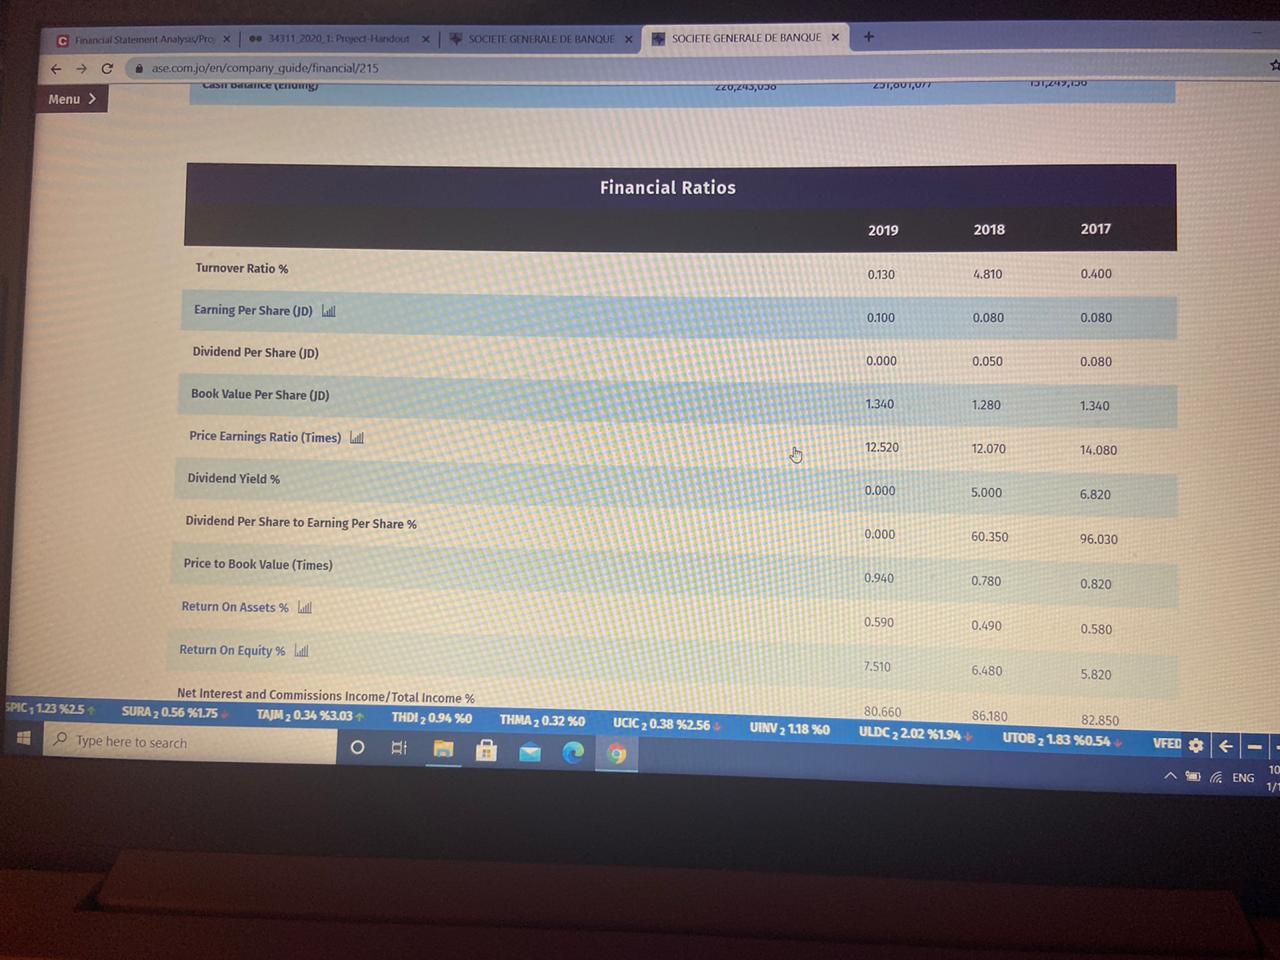
SOCIETE GENERALE DE BANQUE X - 11 2120 Practandout X SOCIETE GENERATE DE RANOLEX C Financial atement Anahex 3.680 ase.comjo/en/company guide/financial/215 (Provision for Credit Facilities Interest in Suspense)/Credit Facilities % 5.500 6.610 Menu > 7.500 7.820 9.920 Equity Ratio 9.590 9.030 12.230 Shareholders Equity/Total Deposits % 92.180 92.500 90.080 Debt Ratio % 81.560 83.110 81.120 Total Deposits/Total Assets % Net Credit Facilities to Total Assets % % 49.560 47.490 48.120 Net Credit Facilities to Total Deposits % 60.760 57.140 59.320 Shareholders Equity to Credit Facilities, Net % 15.790 15.800 20.610 Quick Ratio (Times) 0.200 0.240 0.180 Cash & Investments to Total Deposits % 41.680 43.610 43,370 Cash. Trading Investments / Total Deposits (Times) 0.200 0.240 0.180 3 Download Table 0.34 3.03 THIDI, 0.94 NO THA 032 %0 UCKC, 0.38 2.56 UV, 118 %0 ULDC 2202 SL94 UTOS, 183 KOSA Type here to search VFED 0.89 % WIRE 20.27% o ENC + C Financial Statement Any Pro X 34311 2020 1. Project Handout X SOCIETE GENERALE DE BANQUE X SOCIETE GENERALE DE BANQUE X ase.comjo/en/company guide/financial/215 0.590 0.490 0.580 Menu > Return On Assets % La 7.510 6.480 5.820 Return On Equity % Lidl 80.660 86.180 82.850 Net Interest and Commissions Income/Total Income % Credit Interest/Credit Facilities, Net % % 11.570 9.950 10.120 Net Income / Total Income % 29.530 34.080 30.630 Total Income / Total Assets % 1.990 1.430 1.890 (Provision for Credit Facilities+Interest in Suspense)/Credit Facilities % 5.500 6.610 3.680 Equity Ratio % 7.820 7.500 9.920 Shareholders Equity/Total Deposits % 9.590 9.030 12.230 Debt Ratio % 92.180 92.500 90.080 Total Deposits/Total Assets % 81.560 83.110 81.120 Net Credit Facilities to Total Assets % 49.560 47.490 48.120 Net Credit Facilities to Total Deposits % 60.760 57.140 59,320 Shareholders Equity to Credit Facilities, Net % 15.790 15.800 20.610 Quick Ratio (Times) THDI0.94 00 75 TAJM 20.34 %3.03 THMA 20.32 %0 UCIC 20.38%2.56 0.240 UN1180 0.200 UTOB 2 1.83 %0.54 0.180 ULDC 22.02 %1.94 Type here to search VFED 20.89 %0 O WIRE 20.27 %0 ASH ENG SOCIETE GENERALE DE BANQUE SOCIETE GENERALE DE BANQUE X jo/en/company gulde/financial/215 enu > Shareholders Equity (JD) 2019 2018 2017 Authorized Capital 100,000,000 100,000,000 100,000,000 Subscribed Capital al 100,000,000 100,000,000 100,000,000 Paid in Capital 100,000,000 100,000,000 100,000,000 Legal Reserve 14,501,460 12,880,233 11,627,577 Voluntary Reserve 100,000 100,000 100,000 Other Reserves 0 0 4,965,272 Issuance Premium 0 0 0 Issuance Discount 0 0 0 Treasury Stocks 0 0 0 Cash Dividends ball 0 5,000,000 7,500,000 Stock Dividends 0 0 0 960 Corsican Cimandior andlition NATA 2 1.05 50 NCCo 274 X485 OFTC 20.35 %0 PHNX 038 82 RUMM 20.45 %227+ SALM 21.23%238 SANA 20.53 %1.85 SECO 20.16 %5.88 + Type here to search O m . ENG 10:38 1/10/2 SOCIETE GENERALE DE BANQUE X SOCIETE GENERALE DE BANQUE X c/o denancial/215 Menu > Income Statement (JD) 2019 2018 2017 Interest Income 98,223,829 81,861,650 64,764,865 Interest Expense 73,098,183 62,849,867 45,098,944 Net Interest Income 25,125,646 19,011,783 19,665,921 Net Commissions Income 2,348,534 1,935,497 1,457,100 Interests & Commissions, Net 27,474,180 20,947,280 21,123,021 Gains from Financial Assets and Instruments -177,700 19,000 1,371,392 Gains from Foreign Currencies 1,231,933 1,191,878 921,399 Other Revenues 5,534,418 2,148,682 2,079,789 Total Income 34,062,831 24,306,840 25,495,601 Employees Expenses 7,831,563 6,491,527 5,977,773 Depreciation & Amortization 2,560,291 1,493,451 1,354,927 20.38%27 RUB 20.45 %277 SALM 2 1.23%2.38 SANA 20.53 %1.85 SECO 2 0.16 %5.88 SITT 20.66 %0 SPIC 11.23%25 SURA 2056 %1.75 TAJM 20.34 %3.0: Type here to search O Bi 9 G ENG Trading Information 2019 2018 2017 Par Value/Share (JD) 1.00 1.00 1.00 Closing Price (JD) 1.26 1.00 1.10 Value Traded (JD) 174,649 4,808,526 434,950 No. of Shares Traded 133,095 4,807,190 400,131 No. of Transactions 154 54 108 No. of Subscribed Shares 100,000,000 100,000,000 100,000,000 Market Capitalization (JD) 126,000,000 100,000,000 110,000,000 Fiscal Year Ended 31/12/2019 31/12/2018 31/12/2017 Assets (JD) JDPC 20.29 %0 JESH 20.51 % JNTH 2 046 %4.5% JOEP 11.2%0 JOIB 3.1 %0.66 JOIR 20.37 %2.63 JOPI 2 058 %0 JOPT,25%0 JOST 20.27 %3.84 e to search Bi Assets (JD) 2019 2018 2017 Cash and Balances at Central Banks 193,467,172 224,500,525 104,736,046 Balances at Banks and Financial Institutions 79,012,706 63,076,862 63,860,393 Deposite at Banks and Financial Institutions 5,538,106 56,414,081 33,252,161 Financial Assets at Fair Value Through Profit 0 0 0 Financial Assets at Fair Value Through Other Comprehensive Income 79,182,715 1,593,687 521,392 Financial Assets at Amortized Cost 225,155,531 271,699,711 273,310,111 Investments in Affiliates 0 0 0 Direct Credit Facilities, Net 849,100,023 808,873,745 650,649,448 Provision for Credit Facilities 30,433,934 33,130,335 10,282,930 Interests in Suspense 16,306,702 20,374,072 13,688,353 Deferred Income Tax Assets 3,811,501 5%0 3,013,403 JOST 20.27 %3.84 1,134,764 JRCD 20.4 %2.56 MSFT 0.33 %0 NAQL 20.23 %0 NATA 2 1.05 %0 e to search NCCO 7 8486 OFTC 20.35%0 o PHNX 0388274 RO C Financial Statement Analyses/Pro X 34311 2020. 1: Project Handout SOCIETE GENERALE DE BANQUE X SOCIETE GENERALE DE BANQUE + ase.comjo/en/company guide/financial/215 Menu > Employees Expenses 7,831,563 6,491,527 5,977,773 Depreciation & Amortization 2,560,291 1,493,451 1,354,927 Other Expenses 5,620,421 5,576,019 5,022,522 Provision for Direct Credit and Facilities (period) 1,011,431 -462,229 1,172,662 Sundry Provisions 826,864 -1,318,483 -155,778 Bad Debts Written Off 0 0 Total Expenses 17,850,570 11,780,285 13,372,106 Net Income Before Tax Lill 16,212,261 12,526,555 12,123,495 Income Tax (period) 6,066,933 4,149,275 4,223,808 Income Tax (Previous Years) 0 0 0 Universities and Research Train Fees 0 0 0 Board of Directors Remuniration 85,131 92.335 89,478 Net Income 10,060,197 8,284,945 7,810,209 Non-controlling Interest 0 0 0 20.53 %185 SECO 2 0.16 %5.88 SITT 20.66 %0 SPIC 11.23%25 SURA 20.56 %1.75 TAJM 20.34 %3.03 THD12090 THMA 20.32 %0 Type here to search UCIC 20.38%256 UIMV BI 2. ENG C Financial Statement Analysis Pro 3112020 1. Pred-Handout X SOCIETE GENERALE DE BANQUE SOCIETE GENERALE DE BANQUE + e ase.comjo/en/company guide/financial/215 Menu > Other Reserves 0 0 4,965,272 Issuance Premium 0 0 0 Issuance Discount 0 0 0 Treasury Stocks 0 0 0 Cash Dividends Lill 0 5,000,000 7,500,000 Stock Dividends 0 0 0 Foreign Currencies Translation 0 0 0 Accumulated Change in Fair Value 923,185 -220,155 -212,001 Retained Earnings will 18,507,649 10,068,679 10,111,173 Total Shareholders Equity Lill 134,032,294 127,828,757 134,092,021 Non-controlling Interest 0 0 0 Total Liabilities & Shareholders Equity ball 1,713,282,435 1,703,297,579 1,352,051,323 Income Statement (JD) 366.86 PHMDX 20.38 %27 RUMM 2045%2.77 SALM 21.23 %2.38 SANA 20.53 %1.85 OFTC 20.35 %0 Type here to search SECO 20.16 %5.88 SITT 20.66 %0 SPIC 11.23%25+ SURA ENG SOCIETE GENERALE DE BANQUE X SOCIETE GENERALE DE BANQUE ase.com.jo/en/company guide/financial/215 Trum wwwwwwwwwwwwwwwwwwwww verore www Balances at Banks and Financial Institutions 79,012,706 63,076,862 63,860,393 Deposite at Banks and Financial Institutions 5,538,106 56,414,081 33,252,161 Financial Assets at Fair Value Through Profit O 0 0 Financial Assets at Fair Value Through Other Comprehensive Income 79,182,715 1,593,687 521,392 Financial Assets at Amortized Cost 225,155,531 271,699,711 273,310,111 Investments in Affiliates LO 0 0 Direct Credit Facilities, Net 849,100,023 808,873,745 650,649,448 Provision for Credit Facilities 30,433,934 33,130,335 10,282,930 Interests in Suspense 16,306,702 20,374,072 13,688,353 Deferred Income Tax Assets 3,811,501 3,013,403 1,134,764 Fixed Assets,Net | 28,161,940 29,352,607 22,492,720 Other Assets 249,852,741 244,772,958 202,094,288 Total Assets Lill 1,713,282,435 1,703,297,579 1,352,051,323 FRCD 2 0.4 X2.56 MSFT 1 0.33 ko MAQL 2 0.23 KB NATA 2 1.05% ACCO 2.74 *4.86 OFTC 20.35 $0 PHNX20.38276 RUMM 20.45 %2.27 SALM 21.23 * 10:38 1/10/ e here to search 1 ENG Cancal Statement Analys Pro X141112000 ProsedHandout X SOCETE GENERALE DE BANQUE X + SOCIETE GENERALE DE BANQUE X ase.com jo/en/company guide/financial/215 Menu > 0.130 0.400 Turnover Ratio % 4.810 Earning Per Share (JD) il 0.100 0.080 0.080 Dividend Per Share (D) 0.000 0.050 0.080 Book Value Per Share (JD) 1.340 1.280 1.340 Price Earnings Ratio (Times) Lill 12.520 12.070 14.080 Dividend Yield % 0.000 5.000 6.820 Dividend Per Share to Earning Per Share % 0.000 60.350 96.030 Price to Book Value (Times) 0.940 0.780 0.820 Return On Assets % laill 0.590 0.490 0.580 5 Return On Equity % will 7.510 6.480 5.820 Net Interest and Commissions Income/Total Income % 80.660 86.180 82.850 Credit Interest/Credit Facilities, Net % 11.570 10.120 9.950 Net Income / Total Income % 29.530 34.080 30.630 Total Income / Total Assets % 1.990 1.430 1.890 (Provision for Credit Facilities+Interest in Suspense)/Credit Facilities % SURA 20.56 %1.75 TAJM 2 0.34 %3.03 THD120940 THMA 20.32 %0 UCIC 20.38 %256 HE Type here to search O RI UIN 11880 ULDC 22.02 %194 5.500 6.610 UTOB 2 183 %0.54 3.680 VFED 20.89 % WIRE + 9 ^ ENG 10:3 1/10 C Financial Statement Analysis Pro, X. 343112020 1: Project Handout X SOCIETE GENERALE DE BANQUE X SOCIETE GENERALE DE BANQUE + - ase.comjo/en/company guide/financial/215 Menu > Cash Flow (JD) 2019 2018 2017 Cash Balance (Beginning) 251,801,077 151,249,156 196,812,022 Net Cash Flow from (Used in) Operating Activities 6,294,305 16,239,959 -17,353,267 Net Cash Flow from (Used in) Investing Activities -31,323,408 77,104,714 -19,771,622 Net Cash Flow from (Used in) Financing Activities 377,591 6,345,009 -9,090,811 Differences in Exchange -906,507 862,239 652,834 Cash Balance (Ending) 226,243,058 251,801,077 151,249,156 Financial Ratios 2019 2018 2017 Turnover Ratio % 0.130 4.810 0.400 Earning Per Share (D) Lill 0.100 0.080 0.080 SITT 20.66 %0 Dividend Per Share (D) SPIC 1.23%25 SURA 20.56 %1.75 TAJM 20.34 %3.03 THDT 09480 THMA 20.32% 0.000 10.050 UCIC 20.38 %256 UN1180 Type here to search 0.080 ULDC 22.02 %194 UT A ENG 10 11 C Financial Statement Analyse Pro | Financial Ratios 2019 2018 2017 Turnover Ratio % 0.130 4.810 0.400 Earning Per Share (JD) Lill 0.100 0.080 0.080 Dividend Per Share (JD) 0.000 0.050 0.080 Book Value Per Share (D) ) 1.340 1.280 1.340 Price Earnings Ratio (Times) all 12.520 12.070 14.080 Dividend Yield % 0.000 5.000 6.820 Dividend Per Share to Earning Per Share % 0.000 60.350 96.030 Price to Book Value (Times) 0.940 0.780 0.820 Return On Assets % Lill 0.590 0.490 0.580 Return On Equity % ball 7.510 6.480 5.820 SPIC : 1.23%25 Net Interest and Commissions Income/Total Income % SURA 20.56 %1.75 TAJM 20.34 %3.03+ THD1209400 THMA 2 0.32 %0 UCIC 20.38 %2.56 UINN 11800 80,660 ULDC 22.02 %1.94 86.180 82.850 UTOB 2 1.83 %0.54 Type here to search O VFED DE A i ENG 10 1/1 SOCIETE GENERALE DE BANQUE X - 11 2120 Practandout X SOCIETE GENERATE DE RANOLEX C Financial atement Anahex 3.680 ase.comjo/en/company guide/financial/215 (Provision for Credit Facilities Interest in Suspense)/Credit Facilities % 5.500 6.610 Menu > 7.500 7.820 9.920 Equity Ratio 9.590 9.030 12.230 Shareholders Equity/Total Deposits % 92.180 92.500 90.080 Debt Ratio % 81.560 83.110 81.120 Total Deposits/Total Assets % Net Credit Facilities to Total Assets % % 49.560 47.490 48.120 Net Credit Facilities to Total Deposits % 60.760 57.140 59.320 Shareholders Equity to Credit Facilities, Net % 15.790 15.800 20.610 Quick Ratio (Times) 0.200 0.240 0.180 Cash & Investments to Total Deposits % 41.680 43.610 43,370 Cash. Trading Investments / Total Deposits (Times) 0.200 0.240 0.180 3 Download Table 0.34 3.03 THIDI, 0.94 NO THA 032 %0 UCKC, 0.38 2.56 UV, 118 %0 ULDC 2202 SL94 UTOS, 183 KOSA Type here to search VFED 0.89 % WIRE 20.27% o ENC + C Financial Statement Any Pro X 34311 2020 1. Project Handout X SOCIETE GENERALE DE BANQUE X SOCIETE GENERALE DE BANQUE X ase.comjo/en/company guide/financial/215 0.590 0.490 0.580 Menu > Return On Assets % La 7.510 6.480 5.820 Return On Equity % Lidl 80.660 86.180 82.850 Net Interest and Commissions Income/Total Income % Credit Interest/Credit Facilities, Net % % 11.570 9.950 10.120 Net Income / Total Income % 29.530 34.080 30.630 Total Income / Total Assets % 1.990 1.430 1.890 (Provision for Credit Facilities+Interest in Suspense)/Credit Facilities % 5.500 6.610 3.680 Equity Ratio % 7.820 7.500 9.920 Shareholders Equity/Total Deposits % 9.590 9.030 12.230 Debt Ratio % 92.180 92.500 90.080 Total Deposits/Total Assets % 81.560 83.110 81.120 Net Credit Facilities to Total Assets % 49.560 47.490 48.120 Net Credit Facilities to Total Deposits % 60.760 57.140 59,320 Shareholders Equity to Credit Facilities, Net % 15.790 15.800 20.610 Quick Ratio (Times) THDI0.94 00 75 TAJM 20.34 %3.03 THMA 20.32 %0 UCIC 20.38%2.56 0.240 UN1180 0.200 UTOB 2 1.83 %0.54 0.180 ULDC 22.02 %1.94 Type here to search VFED 20.89 %0 O WIRE 20.27 %0 ASH ENG SOCIETE GENERALE DE BANQUE SOCIETE GENERALE DE BANQUE X jo/en/company gulde/financial/215 enu > Shareholders Equity (JD) 2019 2018 2017 Authorized Capital 100,000,000 100,000,000 100,000,000 Subscribed Capital al 100,000,000 100,000,000 100,000,000 Paid in Capital 100,000,000 100,000,000 100,000,000 Legal Reserve 14,501,460 12,880,233 11,627,577 Voluntary Reserve 100,000 100,000 100,000 Other Reserves 0 0 4,965,272 Issuance Premium 0 0 0 Issuance Discount 0 0 0 Treasury Stocks 0 0 0 Cash Dividends ball 0 5,000,000 7,500,000 Stock Dividends 0 0 0 960 Corsican Cimandior andlition NATA 2 1.05 50 NCCo 274 X485 OFTC 20.35 %0 PHNX 038 82 RUMM 20.45 %227+ SALM 21.23%238 SANA 20.53 %1.85 SECO 20.16 %5.88 + Type here to search O m . ENG 10:38 1/10/2 SOCIETE GENERALE DE BANQUE X SOCIETE GENERALE DE BANQUE X c/o denancial/215 Menu > Income Statement (JD) 2019 2018 2017 Interest Income 98,223,829 81,861,650 64,764,865 Interest Expense 73,098,183 62,849,867 45,098,944 Net Interest Income 25,125,646 19,011,783 19,665,921 Net Commissions Income 2,348,534 1,935,497 1,457,100 Interests & Commissions, Net 27,474,180 20,947,280 21,123,021 Gains from Financial Assets and Instruments -177,700 19,000 1,371,392 Gains from Foreign Currencies 1,231,933 1,191,878 921,399 Other Revenues 5,534,418 2,148,682 2,079,789 Total Income 34,062,831 24,306,840 25,495,601 Employees Expenses 7,831,563 6,491,527 5,977,773 Depreciation & Amortization 2,560,291 1,493,451 1,354,927 20.38%27 RUB 20.45 %277 SALM 2 1.23%2.38 SANA 20.53 %1.85 SECO 2 0.16 %5.88 SITT 20.66 %0 SPIC 11.23%25 SURA 2056 %1.75 TAJM 20.34 %3.0: Type here to search O Bi 9 G ENG Trading Information 2019 2018 2017 Par Value/Share (JD) 1.00 1.00 1.00 Closing Price (JD) 1.26 1.00 1.10 Value Traded (JD) 174,649 4,808,526 434,950 No. of Shares Traded 133,095 4,807,190 400,131 No. of Transactions 154 54 108 No. of Subscribed Shares 100,000,000 100,000,000 100,000,000 Market Capitalization (JD) 126,000,000 100,000,000 110,000,000 Fiscal Year Ended 31/12/2019 31/12/2018 31/12/2017 Assets (JD) JDPC 20.29 %0 JESH 20.51 % JNTH 2 046 %4.5% JOEP 11.2%0 JOIB 3.1 %0.66 JOIR 20.37 %2.63 JOPI 2 058 %0 JOPT,25%0 JOST 20.27 %3.84 e to search Bi Assets (JD) 2019 2018 2017 Cash and Balances at Central Banks 193,467,172 224,500,525 104,736,046 Balances at Banks and Financial Institutions 79,012,706 63,076,862 63,860,393 Deposite at Banks and Financial Institutions 5,538,106 56,414,081 33,252,161 Financial Assets at Fair Value Through Profit 0 0 0 Financial Assets at Fair Value Through Other Comprehensive Income 79,182,715 1,593,687 521,392 Financial Assets at Amortized Cost 225,155,531 271,699,711 273,310,111 Investments in Affiliates 0 0 0 Direct Credit Facilities, Net 849,100,023 808,873,745 650,649,448 Provision for Credit Facilities 30,433,934 33,130,335 10,282,930 Interests in Suspense 16,306,702 20,374,072 13,688,353 Deferred Income Tax Assets 3,811,501 5%0 3,013,403 JOST 20.27 %3.84 1,134,764 JRCD 20.4 %2.56 MSFT 0.33 %0 NAQL 20.23 %0 NATA 2 1.05 %0 e to search NCCO 7 8486 OFTC 20.35%0 o PHNX 0388274 RO C Financial Statement Analyses/Pro X 34311 2020. 1: Project Handout SOCIETE GENERALE DE BANQUE X SOCIETE GENERALE DE BANQUE + ase.comjo/en/company guide/financial/215 Menu > Employees Expenses 7,831,563 6,491,527 5,977,773 Depreciation & Amortization 2,560,291 1,493,451 1,354,927 Other Expenses 5,620,421 5,576,019 5,022,522 Provision for Direct Credit and Facilities (period) 1,011,431 -462,229 1,172,662 Sundry Provisions 826,864 -1,318,483 -155,778 Bad Debts Written Off 0 0 Total Expenses 17,850,570 11,780,285 13,372,106 Net Income Before Tax Lill 16,212,261 12,526,555 12,123,495 Income Tax (period) 6,066,933 4,149,275 4,223,808 Income Tax (Previous Years) 0 0 0 Universities and Research Train Fees 0 0 0 Board of Directors Remuniration 85,131 92.335 89,478 Net Income 10,060,197 8,284,945 7,810,209 Non-controlling Interest 0 0 0 20.53 %185 SECO 2 0.16 %5.88 SITT 20.66 %0 SPIC 11.23%25 SURA 20.56 %1.75 TAJM 20.34 %3.03 THD12090 THMA 20.32 %0 Type here to search UCIC 20.38%256 UIMV BI 2. ENG C Financial Statement Analysis Pro 3112020 1. Pred-Handout X SOCIETE GENERALE DE BANQUE SOCIETE GENERALE DE BANQUE + e ase.comjo/en/company guide/financial/215 Menu > Other Reserves 0 0 4,965,272 Issuance Premium 0 0 0 Issuance Discount 0 0 0 Treasury Stocks 0 0 0 Cash Dividends Lill 0 5,000,000 7,500,000 Stock Dividends 0 0 0 Foreign Currencies Translation 0 0 0 Accumulated Change in Fair Value 923,185 -220,155 -212,001 Retained Earnings will 18,507,649 10,068,679 10,111,173 Total Shareholders Equity Lill 134,032,294 127,828,757 134,092,021 Non-controlling Interest 0 0 0 Total Liabilities & Shareholders Equity ball 1,713,282,435 1,703,297,579 1,352,051,323 Income Statement (JD) 366.86 PHMDX 20.38 %27 RUMM 2045%2.77 SALM 21.23 %2.38 SANA 20.53 %1.85 OFTC 20.35 %0 Type here to search SECO 20.16 %5.88 SITT 20.66 %0 SPIC 11.23%25+ SURA ENG SOCIETE GENERALE DE BANQUE X SOCIETE GENERALE DE BANQUE ase.com.jo/en/company guide/financial/215 Trum wwwwwwwwwwwwwwwwwwwww verore www Balances at Banks and Financial Institutions 79,012,706 63,076,862 63,860,393 Deposite at Banks and Financial Institutions 5,538,106 56,414,081 33,252,161 Financial Assets at Fair Value Through Profit O 0 0 Financial Assets at Fair Value Through Other Comprehensive Income 79,182,715 1,593,687 521,392 Financial Assets at Amortized Cost 225,155,531 271,699,711 273,310,111 Investments in Affiliates LO 0 0 Direct Credit Facilities, Net 849,100,023 808,873,745 650,649,448 Provision for Credit Facilities 30,433,934 33,130,335 10,282,930 Interests in Suspense 16,306,702 20,374,072 13,688,353 Deferred Income Tax Assets 3,811,501 3,013,403 1,134,764 Fixed Assets,Net | 28,161,940 29,352,607 22,492,720 Other Assets 249,852,741 244,772,958 202,094,288 Total Assets Lill 1,713,282,435 1,703,297,579 1,352,051,323 FRCD 2 0.4 X2.56 MSFT 1 0.33 ko MAQL 2 0.23 KB NATA 2 1.05% ACCO 2.74 *4.86 OFTC 20.35 $0 PHNX20.38276 RUMM 20.45 %2.27 SALM 21.23 * 10:38 1/10/ e here to search 1 ENG Cancal Statement Analys Pro X141112000 ProsedHandout X SOCETE GENERALE DE BANQUE X + SOCIETE GENERALE DE BANQUE X ase.com jo/en/company guide/financial/215 Menu > 0.130 0.400 Turnover Ratio % 4.810 Earning Per Share (JD) il 0.100 0.080 0.080 Dividend Per Share (D) 0.000 0.050 0.080 Book Value Per Share (JD) 1.340 1.280 1.340 Price Earnings Ratio (Times) Lill 12.520 12.070 14.080 Dividend Yield % 0.000 5.000 6.820 Dividend Per Share to Earning Per Share % 0.000 60.350 96.030 Price to Book Value (Times) 0.940 0.780 0.820 Return On Assets % laill 0.590 0.490 0.580 5 Return On Equity % will 7.510 6.480 5.820 Net Interest and Commissions Income/Total Income % 80.660 86.180 82.850 Credit Interest/Credit Facilities, Net % 11.570 10.120 9.950 Net Income / Total Income % 29.530 34.080 30.630 Total Income / Total Assets % 1.990 1.430 1.890 (Provision for Credit Facilities+Interest in Suspense)/Credit Facilities % SURA 20.56 %1.75 TAJM 2 0.34 %3.03 THD120940 THMA 20.32 %0 UCIC 20.38 %256 HE Type here to search O RI UIN 11880 ULDC 22.02 %194 5.500 6.610 UTOB 2 183 %0.54 3.680 VFED 20.89 % WIRE + 9 ^ ENG 10:3 1/10 C Financial Statement Analysis Pro, X. 343112020 1: Project Handout X SOCIETE GENERALE DE BANQUE X SOCIETE GENERALE DE BANQUE + - ase.comjo/en/company guide/financial/215 Menu > Cash Flow (JD) 2019 2018 2017 Cash Balance (Beginning) 251,801,077 151,249,156 196,812,022 Net Cash Flow from (Used in) Operating Activities 6,294,305 16,239,959 -17,353,267 Net Cash Flow from (Used in) Investing Activities -31,323,408 77,104,714 -19,771,622 Net Cash Flow from (Used in) Financing Activities 377,591 6,345,009 -9,090,811 Differences in Exchange -906,507 862,239 652,834 Cash Balance (Ending) 226,243,058 251,801,077 151,249,156 Financial Ratios 2019 2018 2017 Turnover Ratio % 0.130 4.810 0.400 Earning Per Share (D) Lill 0.100 0.080 0.080 SITT 20.66 %0 Dividend Per Share (D) SPIC 1.23%25 SURA 20.56 %1.75 TAJM 20.34 %3.03 THDT 09480 THMA 20.32% 0.000 10.050 UCIC 20.38 %256 UN1180 Type here to search 0.080 ULDC 22.02 %194 UT A ENG 10 11 C Financial Statement Analyse Pro | Financial Ratios 2019 2018 2017 Turnover Ratio % 0.130 4.810 0.400 Earning Per Share (JD) Lill 0.100 0.080 0.080 Dividend Per Share (JD) 0.000 0.050 0.080 Book Value Per Share (D) ) 1.340 1.280 1.340 Price Earnings Ratio (Times) all 12.520 12.070 14.080 Dividend Yield % 0.000 5.000 6.820 Dividend Per Share to Earning Per Share % 0.000 60.350 96.030 Price to Book Value (Times) 0.940 0.780 0.820 Return On Assets % Lill 0.590 0.490 0.580 Return On Equity % ball 7.510 6.480 5.820 SPIC : 1.23%25 Net Interest and Commissions Income/Total Income % SURA 20.56 %1.75 TAJM 20.34 %3.03+ THD1209400 THMA 2 0.32 %0 UCIC 20.38 %2.56 UINN 11800 80,660 ULDC 22.02 %1.94 86.180 82.850 UTOB 2 1.83 %0.54 Type here to search O VFED DE A i ENG 10 1/1


