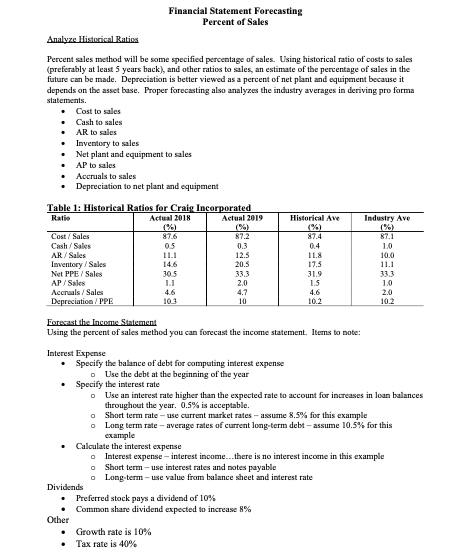
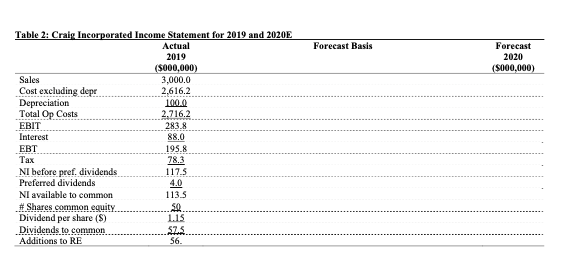
Financial Statement Forecasting Percent of Sales Analyze Historical Ratios Percent sales method will be some specified percentage of sales. Using historical ratio of costs to sales (preferably at least 5 years back), and other ratios to sales an estimate of the percentage of sales in the future can be made. Depreciation is better viewed as a percent of net plant and equipment because it depends on the asset base. Proper forecasting also analyzes the industry averages in deriving pro forma statements. Cost to sales Cash to sales AR to sales Inventory to sales Net plant and equipment to sales AP to sales Accruals to sales Depreciation to net plant and equipment Historical Ave Industry Ave Table 1: Historical Ratios for Craig Incorporated Ratie Actual 2018 Actual 2019 (%) Cost/Sales 87.6 87.2 Cash/ Sales 0.5 0.3 AR/ Sales 11.1 12.5 Inventory/Sales 20.5 Net PPE / Sales 305 33.3 AP/Sales 1.1 2.0 Accruals / Sales 4.6 4.7 Depreciation / PPE 103 10 87.4 04 11.8 17.5 31.9 1.5 82.1 10 10.0 11.1 10 2.0 10.2 10.2 Forecast the Income Statement Using the percent of sales method you can forecast the income statement. Items to note: . Interest Expense Specify the balance of debt for computing interest expense o Use the debt at the beginning of the year Specify the interest rate Use an interest rate higher than the expected rate to account for increases in loan balances throughout the year. 0.5% is acceptable. o Short term rate - use current market rates - assume 8.5% for this example o Long term rate-average rates of current long-term debt-assume 10.5% for this example Calculate the interest expense Interest expense - interest income...there is no interest income in this example o Short term - use interest rates and notes payable o Long-term -use value from balance sheet and interest rate Dividends Preferred stock pays a dividend of 10% Common share dividend expected to increase 8% Other Growth rate is 10% Tax rate is 40% Forecast Basis Forecast 2020 ($000,000) Table 2: Craig Incorporated Income Statement for 2019 and 2020E Actual 2019 ($000,000) Sales 3,000.0 Cost excluding depr 2.616.2 Depreciation 100.0 Total Op Costs 2.716.2 EBIT 283.8 Interest 88.0 EBT 195.8 Tax 78.3 NI before pref. dividends 117.5 Preferred dividends 4.0 NI available to common 113.5 # Shares common equity. SO Dividend per share ($) 1.15 Dividends to common SZ. Additions to RE 56. Financial Statement Forecasting Percent of Sales Analyze Historical Ratios Percent sales method will be some specified percentage of sales. Using historical ratio of costs to sales (preferably at least 5 years back), and other ratios to sales an estimate of the percentage of sales in the future can be made. Depreciation is better viewed as a percent of net plant and equipment because it depends on the asset base. Proper forecasting also analyzes the industry averages in deriving pro forma statements. Cost to sales Cash to sales AR to sales Inventory to sales Net plant and equipment to sales AP to sales Accruals to sales Depreciation to net plant and equipment Historical Ave Industry Ave Table 1: Historical Ratios for Craig Incorporated Ratie Actual 2018 Actual 2019 (%) Cost/Sales 87.6 87.2 Cash/ Sales 0.5 0.3 AR/ Sales 11.1 12.5 Inventory/Sales 20.5 Net PPE / Sales 305 33.3 AP/Sales 1.1 2.0 Accruals / Sales 4.6 4.7 Depreciation / PPE 103 10 87.4 04 11.8 17.5 31.9 1.5 82.1 10 10.0 11.1 10 2.0 10.2 10.2 Forecast the Income Statement Using the percent of sales method you can forecast the income statement. Items to note: . Interest Expense Specify the balance of debt for computing interest expense o Use the debt at the beginning of the year Specify the interest rate Use an interest rate higher than the expected rate to account for increases in loan balances throughout the year. 0.5% is acceptable. o Short term rate - use current market rates - assume 8.5% for this example o Long term rate-average rates of current long-term debt-assume 10.5% for this example Calculate the interest expense Interest expense - interest income...there is no interest income in this example o Short term - use interest rates and notes payable o Long-term -use value from balance sheet and interest rate Dividends Preferred stock pays a dividend of 10% Common share dividend expected to increase 8% Other Growth rate is 10% Tax rate is 40% Forecast Basis Forecast 2020 ($000,000) Table 2: Craig Incorporated Income Statement for 2019 and 2020E Actual 2019 ($000,000) Sales 3,000.0 Cost excluding depr 2.616.2 Depreciation 100.0 Total Op Costs 2.716.2 EBIT 283.8 Interest 88.0 EBT 195.8 Tax 78.3 NI before pref. dividends 117.5 Preferred dividends 4.0 NI available to common 113.5 # Shares common equity. SO Dividend per share ($) 1.15 Dividends to common SZ. Additions to RE 56