

Question
Financial Statements for Walmart Stores Inc. and Macys Inc. The table below contains the financial results for Walmart and Macys for 2012. 1. Compute the
Financial Statements for Walmart Stores Inc. and Macys Inc. The table below contains the financial results for Walmart and Macys for 2012.
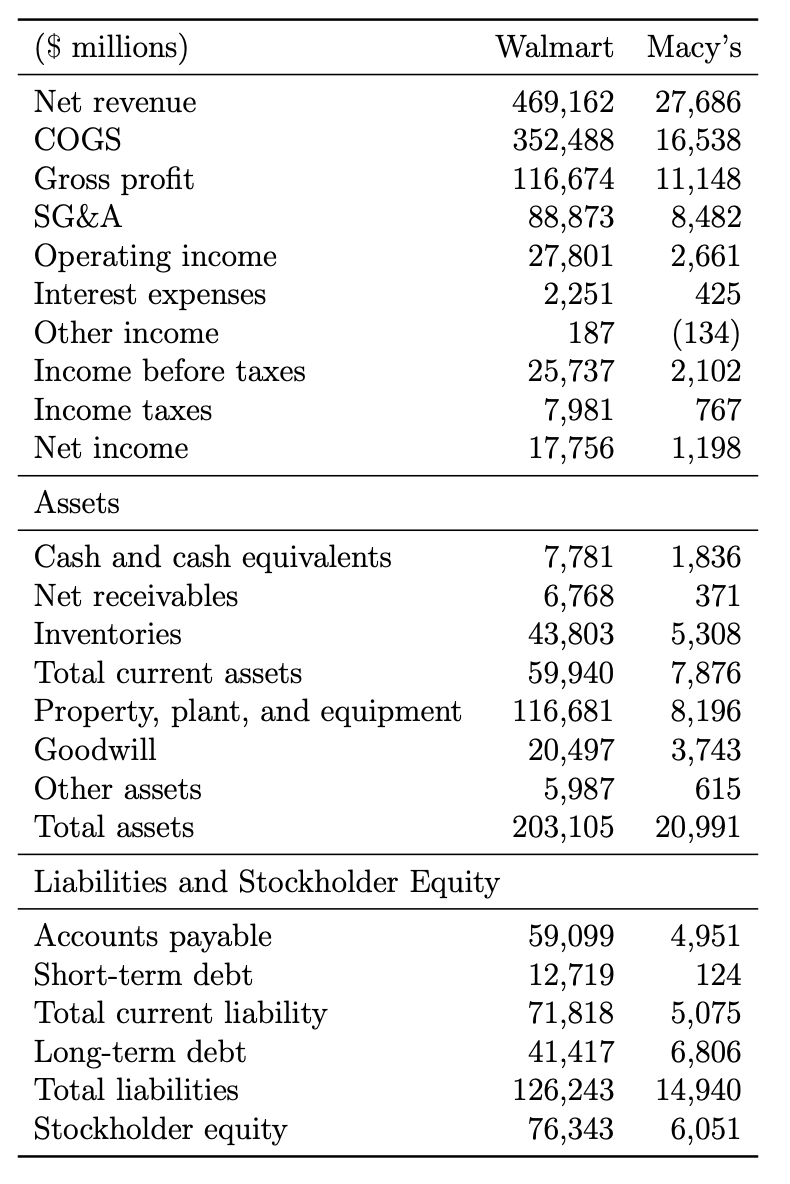
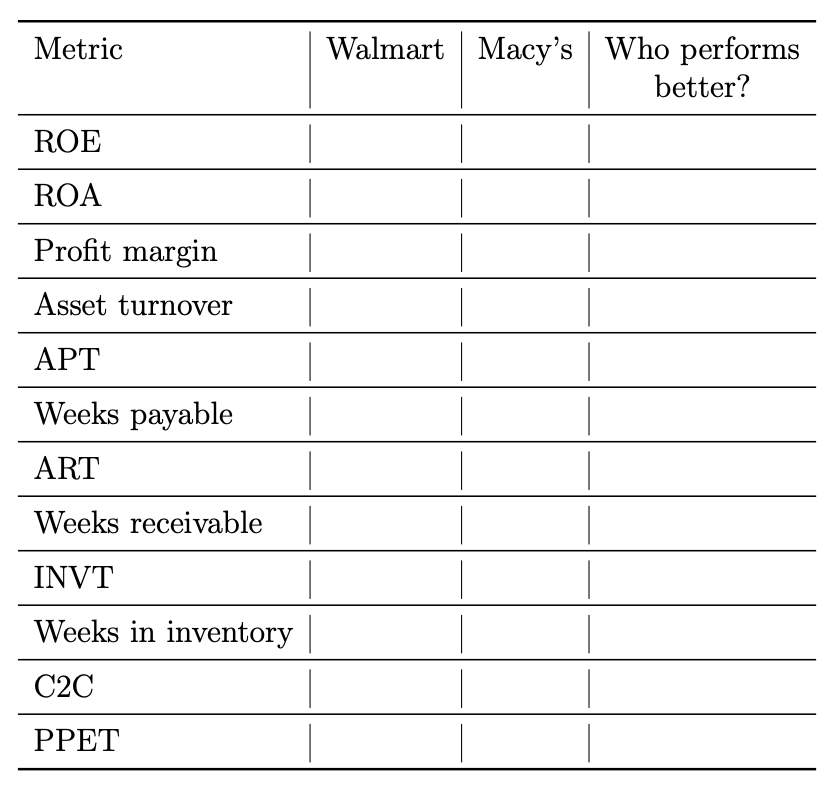
1. Compute the various metrics such as ROE, ROA, profit margin, asset turnover, APT, weeks payable, ART, weeks receivable, C2C, INVT, and PPET. Evaluate the financial performance of each company based on each metric.
2. The table above shows that Walmart has a lower profit margin that Macys, but has a higher ROA. How is this possible?
Explain this with the equation: ROA = Profit Margin Asset Turnover.
($ millions) Net revenue COGS Gross profit SG&A Operating income Interest expenses Other income Income before taxes Income taxes Net income Walmart Macy's 469,162 27,686 352,488 16,538 116,674 11,148 88,873 8,482 27,801 2,661 2,251 425 187 (134) 25,737 2,102 7,981 767 17,756 1,198 Assets Cash and cash equivalents 7,781 Net receivables 6,768 Inventories 43,803 Total current assets 59,940 Property, plant, and equipment 116,681 Goodwill 20,497 Other assets 5,987 Total assets 203,105 Liabilities and Stockholder Equity Accounts payable 59,099 Short-term debt 12,719 Total current liability 71,818 Long-term debt 41,417 Total liabilities 126,243 Stockholder equity 76,343 1,836 371 5,308 7,876 8,196 3,743 615 20,991 4,951 124 5,075 6,806 14,940 6,051 Metric Walmart Macy's Who performs better? ROE ROA Profit margin Asset turnover APT Weeks payable ART Weeks receivable INVT Weeks in inventory C2C PPETStep by Step Solution
There are 3 Steps involved in it
Step: 1

Get Instant Access to Expert-Tailored Solutions
See step-by-step solutions with expert insights and AI powered tools for academic success
Step: 2

Step: 3
Ace Your Homework with AI
Get the answers you need in no time with our AI-driven, step-by-step assistance
Get Started
Financial management theory and practice
Authors: Eugene F. Brigham and Michael C. Ehrhardt
13th edition
1439078106, 111197375X, 9781439078105, 9781111973759, 978-1439078099