 financial summary of Toyota , and utilizing the Excel worksheet -- Take the FY2019 figures -- Calculate B/S P/L percentages/ratios in line with textbook -- Fill in the box provided below -- Rounding (ie number of figures below decimal point) to follow the textbook -- Use 1,792,375 for depreciation/amortization
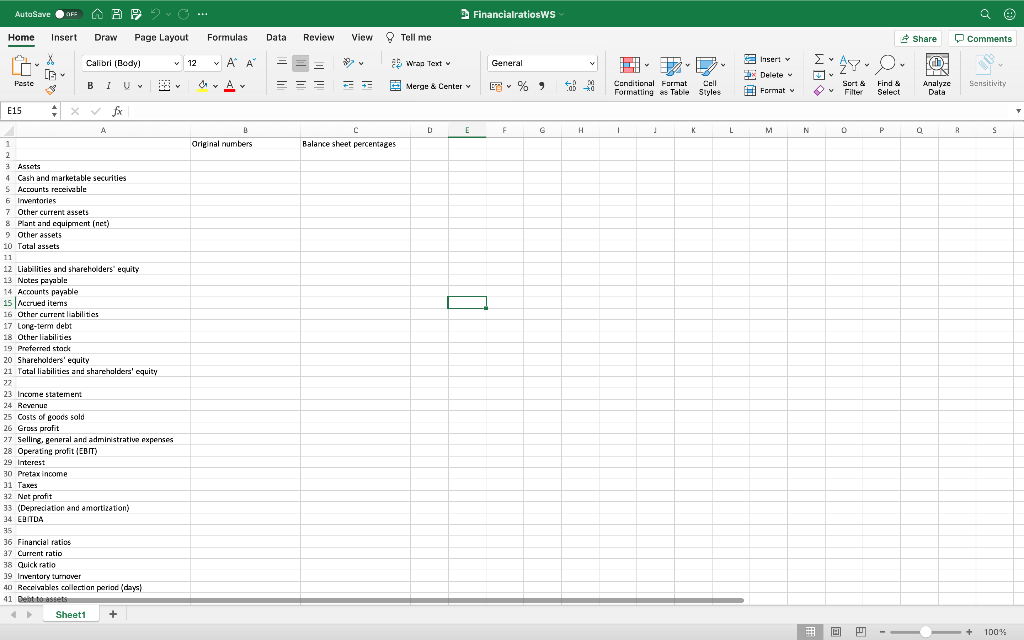
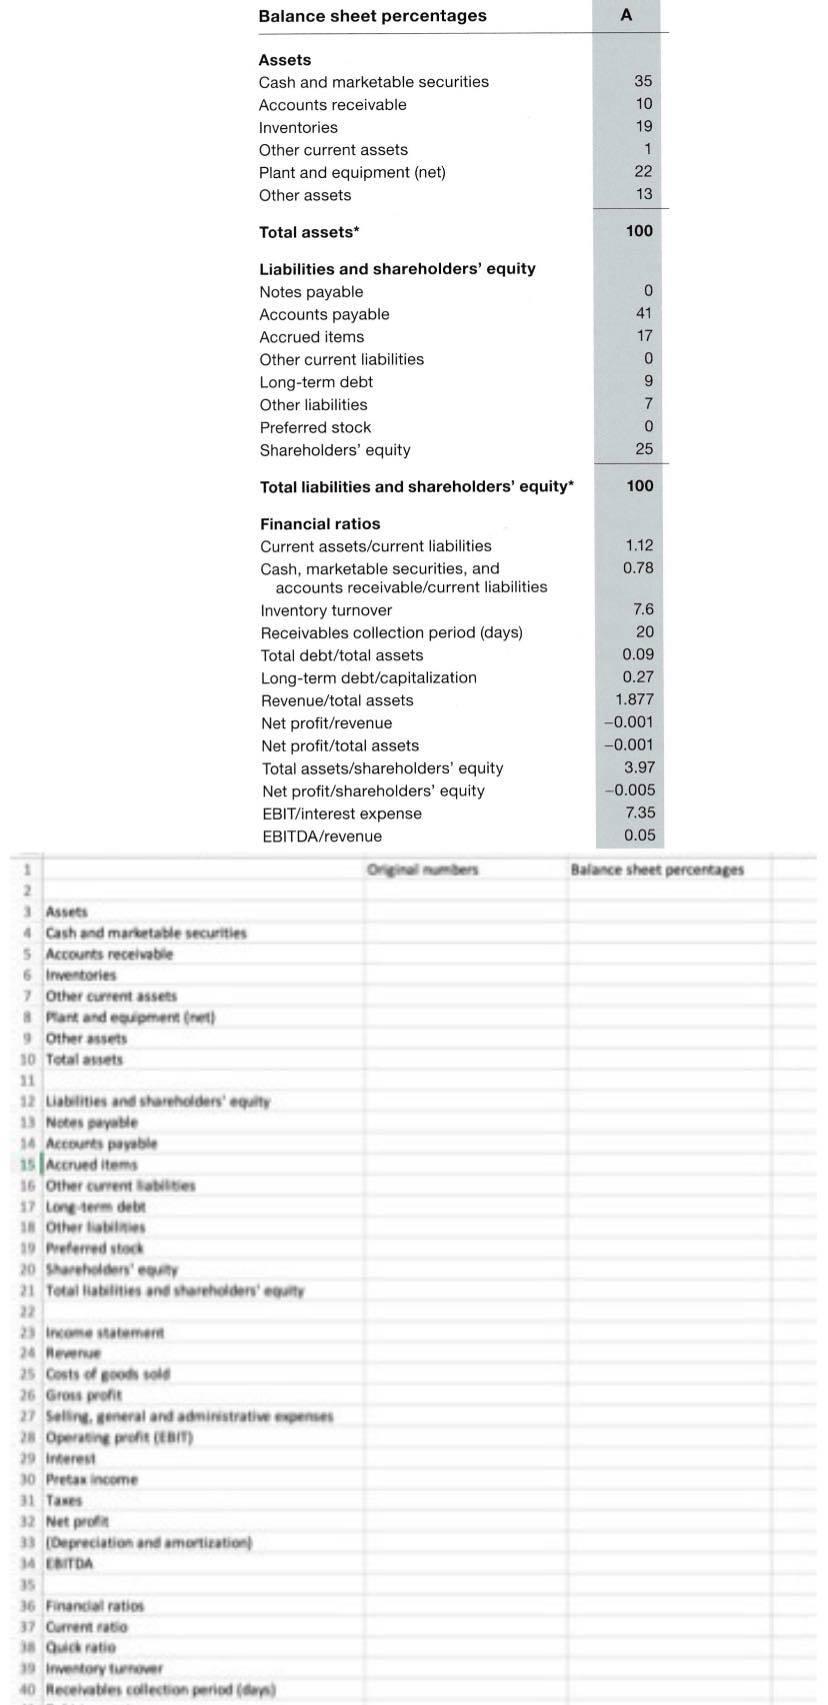
Balance sheet percentages A Assets Cash and marketable securities Accounts receivable Inventories Other current assets Plant and equipment (net) Other assets 35 10 19 1 22 13 Total assets* 100 Liabilities and shareholders' equity Notes payable Accounts payable Accrued items Other current liabilities Long-term debt Other liabilities Preferred stock Shareholders' equity 0 41 17 0 9 7 0 25 Total liabilities and shareholders' equity* 100 1.12 0.78 Financial ratios Current assets/current liabilities Cash, marketable securities, and accounts receivable/current liabilities Inventory turnover Receivables collection period (days) Total debt/total assets Long-term debt/capitalization Revenue/total assets Net profit/revenue Net profit/total assets Total assets/shareholders' equity Net profit/shareholders' equity EBIT/interest expense EBITDA/revenue 7.6 20 0.09 0.27 1.877 -0.001 -0.001 3.97 -0.005 7.35 0.05 Orginaler Balance sheet percentages 1 2 Assets 4 Cash and marbutable securities 5 Accounts receivable 6 Inventories Other current assets # Mart and equipment net) 9 Other assets 10 Total assets 11 12 Latities and shareholders alty 13 Notes payable 14 Accounts payable 15 Accrued items 16 Other current sites 17 Long-term der 18 Other in 19 Preferred stock 20 Storeholders 21 Total liabilities and shareholders uity 22 23 Income statement 24 New 25 Costs of goods sold 26 Gross profit 27 Selling general and administrative expenses 28 Operating profit (EBIT) 29 Interest 30 Pretax income 32 Net profit 33 Depreciation and amortization 14 EMITDA 35 36 Financial ratios 37 Current ratio 38 Quick ratio 39 Inventory turnover 10 Receivables collection periode AutoSave OF APvc ... Financialratiosws Home Insert Draw Page Layout Formulas Data Review View Tell me Share 0 Comments Calibri (Body) v 12 ~ Al A ah Wrag Text General X [G v Insert v Delete AY Paste A Merge & Center v ES % ) Conditional Format Cell Formatting as Table Styles Sensitivity Format v Sort & Filter Analyze Data y Find & Select T E15 A D E F H 1 1 K L M N P R S B Original numbers C Balance sheet percentages 1 2 3 3 Assets 4 Cash and marketable securities S Accounts receivable 6 Inwentaries 7 Other current assets & Plant and equipment (net) 9 Other assets 10 Tatal assets 11 12 Liabilities and shareholders' equity 13 Notes payable 14 Accounts payable 1s Accrued itens 16 Other current liabilities 17 Long-term debt 18 Other liabilities 19 Preferred stark 20 Shareholders' equity 21 Tatal liabilities and shareholders' equity 22 23 Income statement 24 Revenue 25 Costs of goods sold 26 Gross profit 27 Selling, general and administrative expenses 28 Operating profit (EBIT) 29 Interest 30 Pretax income 31 Taxes 32 Net profit 33 (Depreciation and amortization) 34 EBITDA 35 36 Financial ratios 27 Current ratio 38 Quick ratio 19 Inventory turnover 40 Receivables collection period (days 41 Debt to assets Sheet1 + + 100% Balance sheet percentages A Assets Cash and marketable securities Accounts receivable Inventories Other current assets Plant and equipment (net) Other assets 35 10 19 1 22 13 Total assets* 100 Liabilities and shareholders' equity Notes payable Accounts payable Accrued items Other current liabilities Long-term debt Other liabilities Preferred stock Shareholders' equity 0 41 17 0 9 7 0 25 Total liabilities and shareholders' equity* 100 1.12 0.78 Financial ratios Current assets/current liabilities Cash, marketable securities, and accounts receivable/current liabilities Inventory turnover Receivables collection period (days) Total debt/total assets Long-term debt/capitalization Revenue/total assets Net profit/revenue Net profit/total assets Total assets/shareholders' equity Net profit/shareholders' equity EBIT/interest expense EBITDA/revenue 7.6 20 0.09 0.27 1.877 -0.001 -0.001 3.97 -0.005 7.35 0.05 Orginaler Balance sheet percentages 1 2 Assets 4 Cash and marbutable securities 5 Accounts receivable 6 Inventories Other current assets # Mart and equipment net) 9 Other assets 10 Total assets 11 12 Latities and shareholders alty 13 Notes payable 14 Accounts payable 15 Accrued items 16 Other current sites 17 Long-term der 18 Other in 19 Preferred stock 20 Storeholders 21 Total liabilities and shareholders uity 22 23 Income statement 24 New 25 Costs of goods sold 26 Gross profit 27 Selling general and administrative expenses 28 Operating profit (EBIT) 29 Interest 30 Pretax income 32 Net profit 33 Depreciation and amortization 14 EMITDA 35 36 Financial ratios 37 Current ratio 38 Quick ratio 39 Inventory turnover 10 Receivables collection periode AutoSave OF APvc ... Financialratiosws Home Insert Draw Page Layout Formulas Data Review View Tell me Share 0 Comments Calibri (Body) v 12 ~ Al A ah Wrag Text General X [G v Insert v Delete AY Paste A Merge & Center v ES % ) Conditional Format Cell Formatting as Table Styles Sensitivity Format v Sort & Filter Analyze Data y Find & Select T E15 A D E F H 1 1 K L M N P R S B Original numbers C Balance sheet percentages 1 2 3 3 Assets 4 Cash and marketable securities S Accounts receivable 6 Inwentaries 7 Other current assets & Plant and equipment (net) 9 Other assets 10 Tatal assets 11 12 Liabilities and shareholders' equity 13 Notes payable 14 Accounts payable 1s Accrued itens 16 Other current liabilities 17 Long-term debt 18 Other liabilities 19 Preferred stark 20 Shareholders' equity 21 Tatal liabilities and shareholders' equity 22 23 Income statement 24 Revenue 25 Costs of goods sold 26 Gross profit 27 Selling, general and administrative expenses 28 Operating profit (EBIT) 29 Interest 30 Pretax income 31 Taxes 32 Net profit 33 (Depreciation and amortization) 34 EBITDA 35 36 Financial ratios 27 Current ratio 38 Quick ratio 19 Inventory turnover 40 Receivables collection period (days 41 Debt to assets Sheet1 + + 100%