Financials Today Current year with comparison to a competitor. What are they doing? How are they doing now? Add current events and focus on the current financials. Include an evaluation for each type of (LAPM) ratio for the current year, then an overall comparison to validate your conclusion. Include your findings for your competitor.
**Compare Walmart as the primary company and Target as the competitor** I need the charts below filled out **
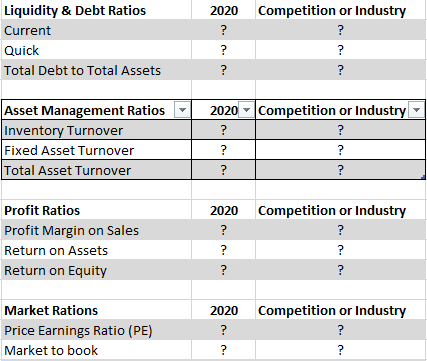
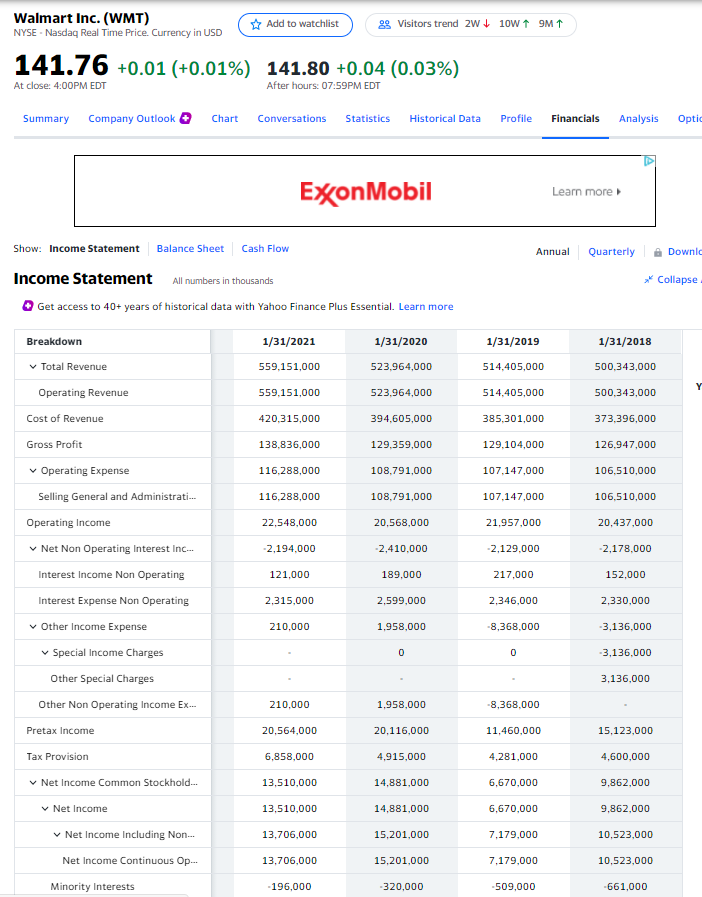
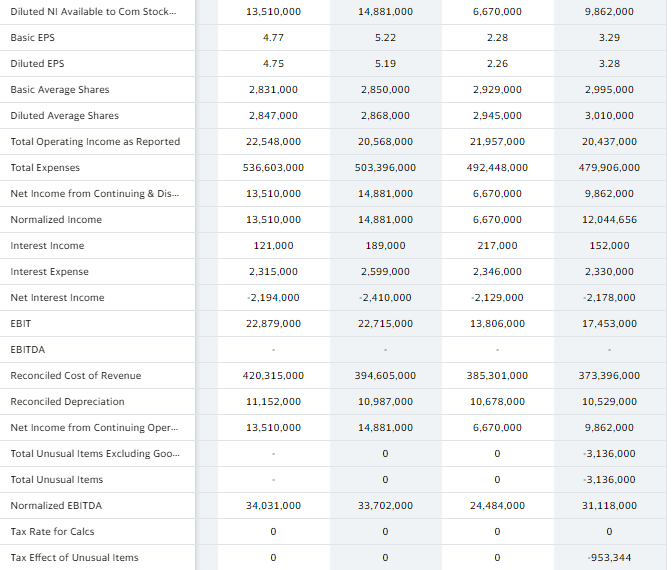
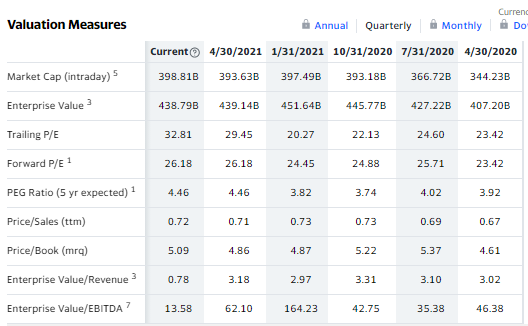
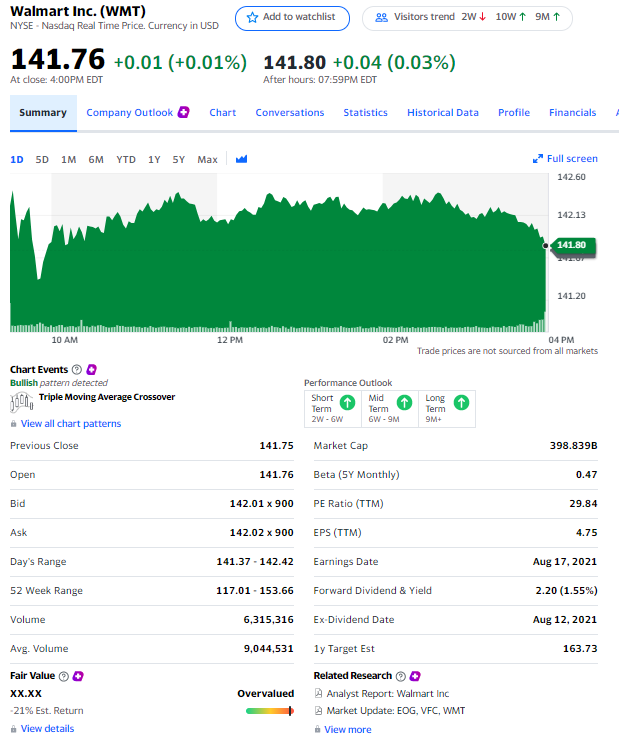
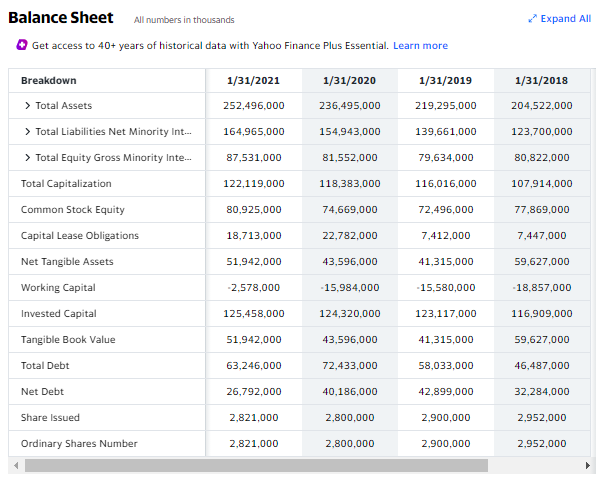
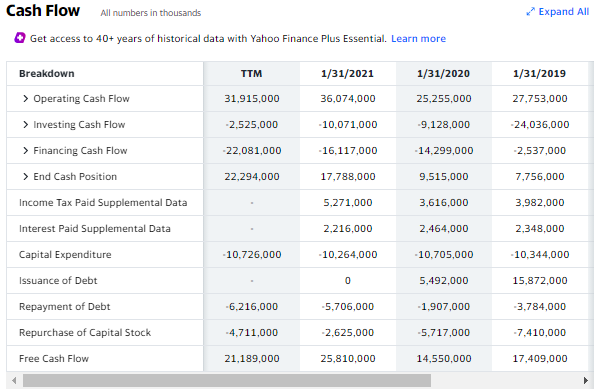
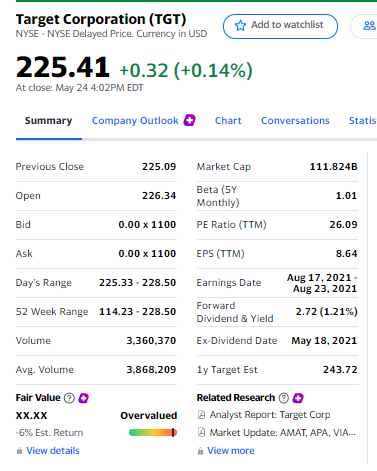
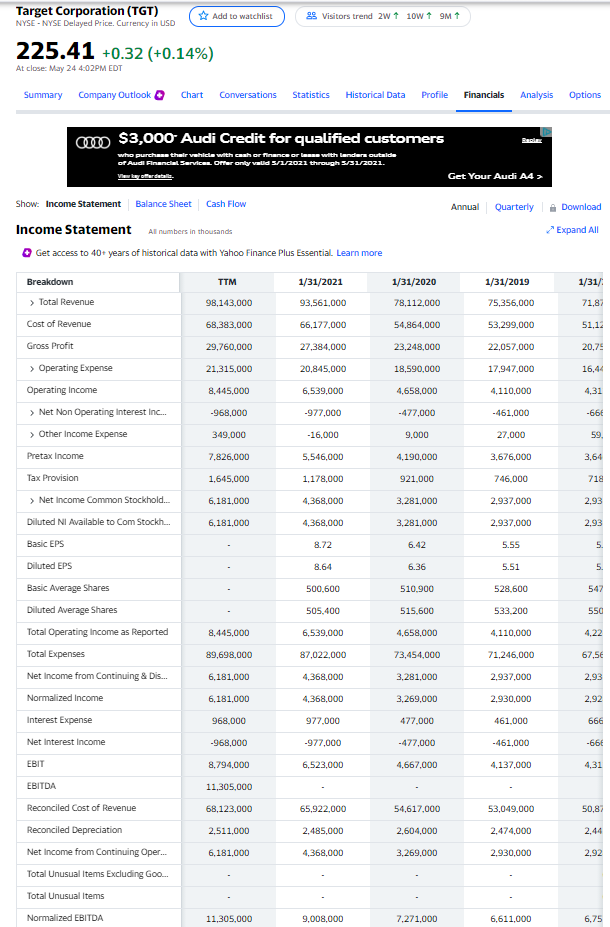
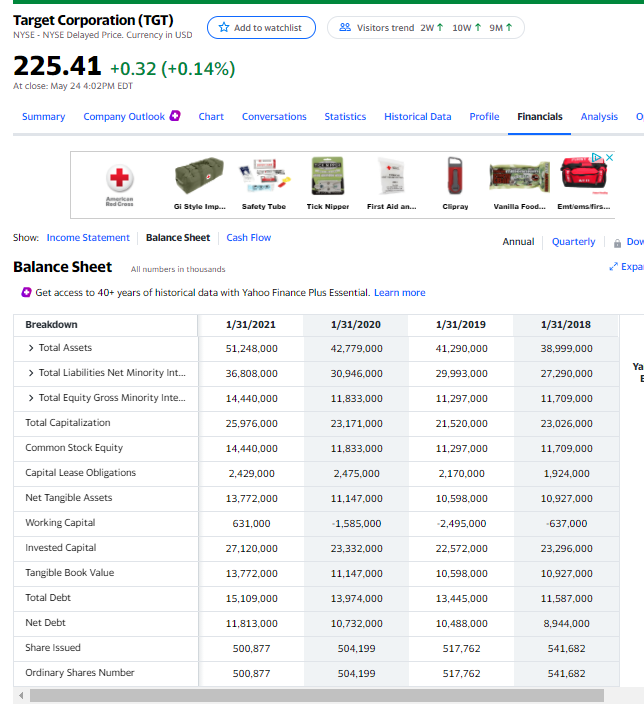
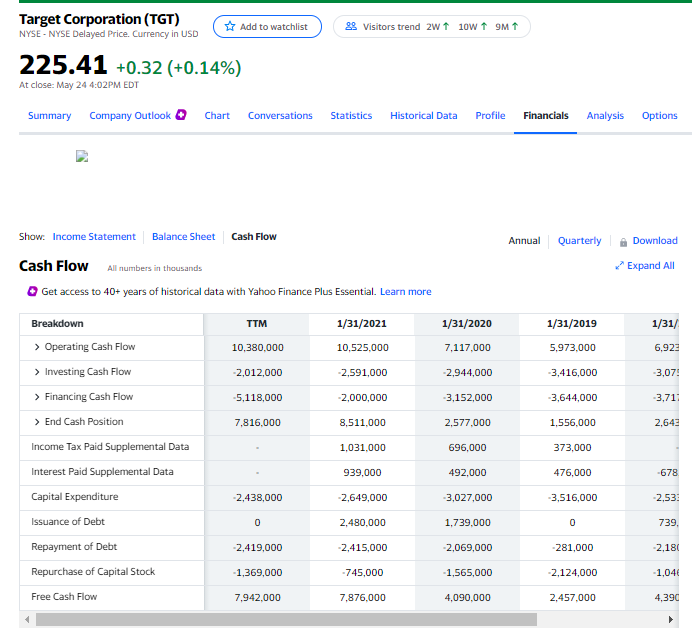
Liquidity & Debt Ratios Current Quick Total Debt to Total Assets 2020 Competition or Industry ? ? ? ? ? ? Asset Management Ratios Inventory Turnover Fixed Asset Turnover Total Asset Turnover 2020 Competition or Industry ? ? ? ? ? ? Profit Ratios Profit Margin on Sales Return on Assets Return on Equity 2020 ? ? ? Competition or Industry ? ? ? Market Rations Price Earnings Ratio (PE) Market to book 2020 ? ? Competition or Industry ? ? Walmart Inc. (WMT) NYSE - Nasdaq Real Time Price. Currency in USD Add to watchlist 29 Visitors trend 2w10w 9MT 141.76 +0.01 (+0.01%) 141.80 +0.04 (0.03%) At close: 4:00PM EDT After hours: 07:59PM EDT Summary Company Outlook Chart Conversations Statistics Historical Data Profile Financials Analysis Optic ExxonMobil Learn more Show: Income Statement Balance Sheet Cash Flow Annual Quarterly Downld Collapse Income Statement All numbers in thousands Get access to 40+ years of historical data with Yahoo Finance Plus Essential. Learn more Breakdown 1/31/2021 559.151,000 1/31/2020 523.964,000 1/31/2019 514,405,000 1/31/2018 500,343,000 500,343,000 Total Revenue Operating Revenue Cost of Revenue Y 559,151,000 523.964,000 514,405,000 420.315,000 394,605,000 385.301.000 373.396,000 Gross Profit 138,836,000 129.359,000 129,104,000 126,947,000 116,288,000 108.791,000 107,147,000 106.510,000 116,288,000 108,791,000 107,147,000 106,510,000 22.548,000 20.568,000 21,957,000 20,437,000 -2.194.000 -2.410.000 -2,129.000 -2,178,000 121,000 189.000 217,000 152.000 2,315.000 2,599.000 2.346,000 2,330,000 210,000 1.958.000 -8,368,000 -3,136.000 Operating Expense Selling General and Administrati... Operating Income Net Non Operating Interest In.... Interest Income Non Operating Interest Expense Non Operating Other Income Expense Special Income Charges Other Special Charges Other Non Operating Income Ex... Pretax Income Tax Provision Net Income Common Stockhold... Net Income Net Income Including Non... 0 0 -3,136.000 3.136,000 210,000 1,958,000 -8,368.000 20,564,000 20,116,000 11,460,000 15,123,000 6,858.000 4,915.000 4,281,000 4,600,000 13,510,000 14,881.000 6,670,000 9.862.000 13,510,000 14,881.000 6,670,000 9,862.000 13,706,000 15,201,000 7,179,000 10,523,000 Net Income Continuous Op... 13,706.000 15,201,000 7.179.000 10.523,000 Minority Interests -196,000 -320,000 -509,000 -661,000 Diluted NI Available to Com Stock... 13,510,000 14,881,000 6,670.000 9.862,000 Basic EPS 4.77 5.22 2.28 3.29 4.75 5.19 2.26 3.28 2,831,000 2.850.000 2,929,000 2.995,000 2.847.000 2,868,000 2.945,000 3,010,000 22.548,000 20,568,000 21,957,000 20,437,000 Diluted EPS Basic Average Shares Diluted Average Shares Total Operating Income as Reported Total Expenses Net Income from Continuing & Dis... Normalized Income Interest Income 536.603,000 503.396,000 492,448,000 479.906,000 13,510.000 14,881,000 6,670.000 9,862,000 13,510,000 14.881,000 6,670,000 12,044,656 121,000 189.000 217.000 152.000 Interest Expense 2,315.000 2,599,000 2.346,000 2,330,000 Net Interest Income -2,194.000 -2,410.000 -2,129.000 -2,178.000 EBIT 22,879,000 22.715,000 13,806,000 17.453,000 EBITDA Reconciled Cost of Revenue 420.315,000 394.605,000 385.301,000 373.396,000 11.152,000 10,987,000 10,678,000 10,529,000 13,510,000 14.881,000 6,670,000 9,862,000 0 0 -3,136.000 Reconciled Depreciation Net Income from Continuing Oper... Total Unusual Items Excluding Goo... Total Unusual Items Normalized EBITDA Tax Rate for Calcs 0 0 -3,136.000 34,031,000 33,702,000 24,484,000 31,118.000 0 0 0 0 Tax Effect of Unusual Items 0 0 0 -953,344 Valuation Measures Curreng Do Annual Quarterly Monthly Current 4/30/2021 1/31/2021 10/31/2020 7/31/20204/30/2020 398.81B 393.63B 397.49B 393.18B 366.72B 344.23B Market Cap (intraday) Enterprise Value 438.79B 439.14B 451.64B 445.77B 427.22B 407.20B 32.81 29.45 20.27 22.13 24.60 23.42 26.18 26.18 24.45 24.88 25.71 23.42 Trailing P/E Forward P/E 1 PEG Ratio (5 yr expected) 1 Price/Sales (ttm) 4.46 4.46 3.82 3.74 4.02 3.92 0.72 0.71 0.73 0.73 0.69 0.67 Price/Book (mra) 5.09 4.86 4.87 5.22 5.37 4.61 Enterprise Value/Revenue 3 0.78 3.18 2.97 3.31 3.10 3.02 Enterprise Value/EBITDA? 13.58 62.10 164.23 42.75 35.38 46.38 Walmart Inc. (WMT) NYSE - Nasdaq Real Time Price. Currency in USD * Add to watchlist 29 Visitors trend zw+ 10w T 9M 1 141.76 +0.01 (+0.01%) 141.80 +0.04 (0.03%) At close: 4:00PM EDT After hours: 07:59PM EDT Summary Company Outlook Chart Conversations Statistics Historical Data Profile Financials 1D 5D IM 6M YTD 1Y SY Max Full screen 142.60 142.13 141.80 141.20 10 AM 12 PM 02 PM 04 PM Trade prices are not sourced from all markets Chart Events Bullish pattern detected 1000, Triple Moving Average Crossover Performance Outlook Short Mid Term Term 2W - GW GW-9M Long Term 9M+ View all chart patterns Previous Close 141.75 Market Cap 398.839B Open 141.76 Beta (5Y Monthly) 0.47 Bid 142.01 x 900 PE Ratio (TTM) 29.84 Ask 142.02 x 900 EPS (TTM) 4.75 Day's Range 141.37 - 142.42 Earnings Date Aug 17, 2021 52 Week Range 117.01 - 153.66 Forward Dividend & Yield 2.20 (1.55%) Volume 6,315,316 Ex-Dividend Date Aug 12, 2021 Avg. Volume 9,044,531 1y Target Est 163.73 Related Research Overvalued Fair Value XX.XX -21% Est. Return View details Analyst Report: Walmart Inc Market Update: EOG, VEC, WMT View more Expand All Balance Sheet All numbers in thousands Get access to 40+ years of historical data with Yahoo Finance Plus Essential. Learn more 1/31/2021 1/31/2019 1/31/2020 236,495.000 1/31/2018 204,522,000 252,496,000 219,295.000 164,965,000 154,943,000 139,661,000 123,700,000 87,531,000 81,552,000 79,634,000 80,822,000 122,119.000 118,383.000 116,016,000 107,914,000 80,925,000 74,669,000 72,496,000 77,869,000 18,713,000 22,782,000 7,412,000 7,447,000 Breakdown > Total Assets > Total Liabilities Net Minority Int... > Total Equity Gross Minority Inte... Total Capitalization Common Stock Equity Capital Lease Obligations Net Tangible Assets Working Capital Invested Capital Tangible Book Value Total Debt Net Debt Share issued Ordinary Shares Number 51,942,000 43,596.000 41,315.000 59,627.000 -2.578,000 - 15,984,000 -15.580,000 -18.857.000 125,458,000 124,320,000 123,117,000 116,909.000 51,942,000 43,596.000 41,315.000 59,627,000 63,246,000 72,433,000 58,033,000 46,487.000 26,792,000 40,186,000 42,899,000 32,284,000 2,821,000 2,800,000 2,900,000 2,952,000 2,821,000 2,800,000 2.900.000 2,952,000 Expand All Cash Flow All numbers in thousands Get access to 40+ years of historical data with Yahoo Finance Plus Essential. Learn more TTM 1/31/2021 1/31/2020 1/31/2019 31,915,000 36,074,000 25,255,000 27,753,000 -2.525,000 -10,071,000 -9.128,000 -24.036,000 -22.081,000 -16.117,000 - 14.299,000 -2.537,000 22,294,000 17,788,000 9,515,000 7,756,000 Breakdown > Operating Cash Flow > Investing Cash Flow > Financing Cash Flow > End Cash Position Income Tax Paid Supplemental Data Interest Paid Supplemental Data Capital Expenditure Issuance of Debt Repayment of Debt Repurchase of Capital Stock 5,271,000 3,616,000 3,982,000 2,216.000 2,464,000 2,348,000 -10.726,000 - 10.264,000 -10.705,000 -10.344,000 0 5,492,000 15,872.000 -6,216,000 -5,706,000 -1.907.000 -3,784,000 -4.711,000 -2.625,000 -5,717,000 -7.410,000 Free Cash Flow 21,189,000 25,810,000 14,550.000 17,409,000 89 Target Corporation (TGT) Add to watchlist NYSE - NYSE Delayed Price. Currency in USD 225.41 +0.32 (+0.14%) At close: May 24 4:02PM EDT Summary Company Outlook Chart Conversations Statis Previous Close 225.09 Market Cap 111.824B Open 226.34 1.01 Beta (5Y Monthly) PE Ratio (TTM) Bid 0.00 x 1100 26.09 Ask 0.00 x 1100 EPS (TTM) 8.64 Day's Range 225.33.228.50 52 Week Range 114.23.228.50 Earnings Date Aug 17, 2021 Aug 23, 2021 Forward 2.72 (1.21%) Dividend & Yield Ex-Dividend Date May 18, 2021 Volume 3,360,370 Avg. Volume 3,868,209 1y Target Est 243.72 Fair Value Overvalued XX.XX -6% Est. Return View details Related Research Analyst Report: Target Corp Market Update: AMAT, APA, VIA... View more Target Corporation (TGT) NYSE - NYSE Delayed Price. Currency in USD Add to watchlist Visitors trend 2w1 10w + 9M 225.41 +0.32 (+0.14%) At close: May 24 4:02PM EDT Summary Company Outlook Chart Conversations Statistics Historical Data Profile Financials Analysis Options a $3,000- Audi Credit for qualified customers who purchase their valda with cash or finance or with anders outside of Audi Financial Services offer only valid 5/1/2021 through 3/31/2021. reballs Get Your Audi A4 Annual Quarterly Download Show: Income Statement Balance Sheet Cash Flow Income Statement Al numbers in thousands Get access to 40+ years of historical data with Yahoo Finance Plus Essential. Learn more Expand All TTM 1/31/2020 1/31/2019 1/31/ Breakdown > Total Revenue 1/31/2021 93,561.000 98,143,000 78,112,000 75,356,000 71,87 Cost of Revenue 68,383,000 66,177,000 54,864,000 53,299,000 51,12 Gross Profit 29,760,000 27,384,000 23,248,000 22.057.000 20,75 21,315,000 20,845,000 18,590,000 17.947.000 16,4 8,445,000 6,539,000 4,658,000 4.110,000 4.31 > Operating Expense Operating Income > Net Non Operating interest Inc... > Other Income Expense -968.000 -977,000 -477.000 -461,000 -666 349,000 -16,000 9,000 27,000 59, Pretax Income 7,826,000 5,546,000 4,190,000 3,676,000 3,64 Tax Provision 1,645.000 1,178,000 921,000 746.000 718 6,181,000 4,368,000 3.281,000 2,937,000 2.93 > Net Income Common Stockhold... Diluted NI Available to Com Stockh... 6,181,000 4,368,000 3,281,000 2.937.000 2.93 Basic EPS 8.72 6.42 5.55 5. Diluted EPS 8.64 6.36 5.51 5. 500,600 510.900 528,600 547 505.400 515,600 533.200 550 8.445.000 6,539.000 4,658,000 4,110,000 4,22 89,698,000 87,022,000 73,454,000 71.246,000 67,5 Basic Average Shares Diluted Average Shares Total Operating Income as Reported Total Expenses Net Income from Continuing & Dis... Normalized Income Interest Expense Net Interest Income 6,181,000 4,368,000 3.281,000 2,937,000 2.93 6,181,000 4.368.000 3.269,000 2.930,000 2.92 968,000 977,000 477,000 461,000 666 -968,000 -977,000 -477,000 -461,000 -666 EBIT 8,794,000 6,523,000 4,667,000 4.137.000 4.31 EBITDA 11.305.000 Reconciled Cost of Revenue 68,123,000 65.922.000 54.617.000 53,049,000 50,87 Reconciled Depreciation 2,511,000 2.485.000 2,604,000 2,474,000 2,44 Net Income from Continuing Oper... 6,181,000 4.368,000 3.269,000 2.930,000 2.92 Total Unusual Items Excluding Goo... Total Unusual Items Normalized EBITDA 11,305,000 9,008,000 7.271.000 6,611,000 6,75 29 Visitors trend zw 1 10w 9M Target Corporation (TGT) Add to watchlist NYSE - NYSE Delayed Price. Currency in USD 225.41 +0.32 (+0.14%) At close: May 24 4:02PM EDT Summary Company Outlook Chart Conversations Statistics Historical Data Profile Financials Analysis O Gi Style Imp... Safety Tube Tick Nipper First Aid an... Clipray Vanilla Food... Emblems. Firs.... Annual Quarterly Dov Show. Income Statement Balance Sheet Cash Flow Balance Sheet All numbers in thousands Get access to 40+ years of historical data with Yahoo Finance Plus Essential. Learn more Expa 1/31/2021 1/31/2020 1/31/2019 1/31/2018 51,248,000 42.779.000 41,290.000 38,999,000 36,808,000 30,946.000 29,993,000 27,290,000 Ya E 14,440.000 11,833,000 11,297,000 11,709,000 25,976,000 23.171.000 21,520,000 23,026,000 Breakdown > Total Assets > Total Liabilities Net Minority Int... > Total Equity Gross Minority Inte... Total Capitalization Common Stock Equity Capital Lease Obligations Net Tangible Assets Working Capital Invested Capital Tangible Book Value 14,440.000 11,833.000 11,297,000 11,709,000 2,429.000 2,475,000 2,170,000 1,924.000 13,772.000 11.147.000 10,598.000 10.927.000 631,000 -1,585,000 -2.495,000 -637,000 27.120.000 23,332.000 22.572.000 23,296,000 13,772.000 11.147.000 10.598.000 10,927.000 Total Debt 15,109,000 13,974.000 13,445,000 11,587,000 Net Debt 11,813,000 10.732.000 10,488,000 8.944,000 Share Issued 500,877 504.199 517.762 541,682 Ordinary Shares Number 500,877 504.199 517,762 541,682 49 Visitors trend zw 1 10W + 9M 1 Target Corporation (TGT) # Add to watchlist NYSE - NYSE Delayed Price. Currency in USD 225.41 +0.32 (+0.14%) At close: May 24 4:02PM EDT Summary Company Outlook Chart Conversations Statistics Historical Data Profile Financials Analysis Options Show. Income Statement Balance Sheet Cash Flow Annual Quarterly Download Expand All Cash Flow All numbers in thousands Get access to 40+ years of historical data with Yahoo Finance Plus Essential. Learn more TTM 1/31/2021 1/31/2020 1/31/2019 1/31/ 10,380,000 10,525,000 7,117,000 5,973.000 6.923 -2,012.000 -2,591,000 -2,944,000 -3,416,000 -3.07! -5,118,000 -2,000,000 -3,152,000 -3,644,000 -3,711 7.816.000 8,511,000 2,577,000 1,556,000 2.643 Breakdown > Operating Cash Flow > Investing Cash Flow > Financing Cash Flow > End Cash Position Income Tax Paid Supplemental Data Interest Paid Supplemental Data Capital Expenditure Issuance of Debt Repayment of Debt Repurchase of Capital Stock 1,031,000 696,000 373,000 939,000 492,000 476,000 -678 -2,438,000 -2,649,000 -3,027,000 -3,516,000 -2.53 0 2,480.000 1,739,000 0 739 2,419,000 -2,415,000 -2,069,000 -281,000 -2,181 -1,369,000 -745,000 -1,565,000 -2,124,000 -1,046 Free Cash Flow 7.942.000 7,876.000 4.090.000 2.457.000 4,390