#FinanicalAnalysis
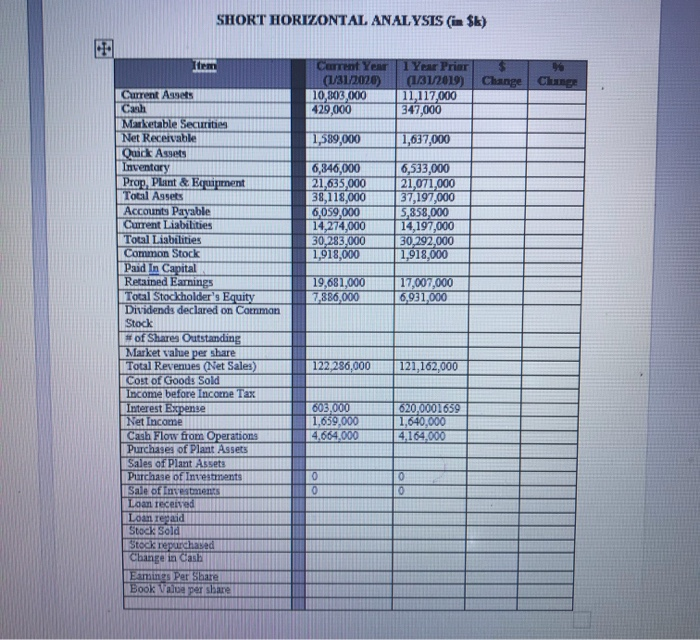
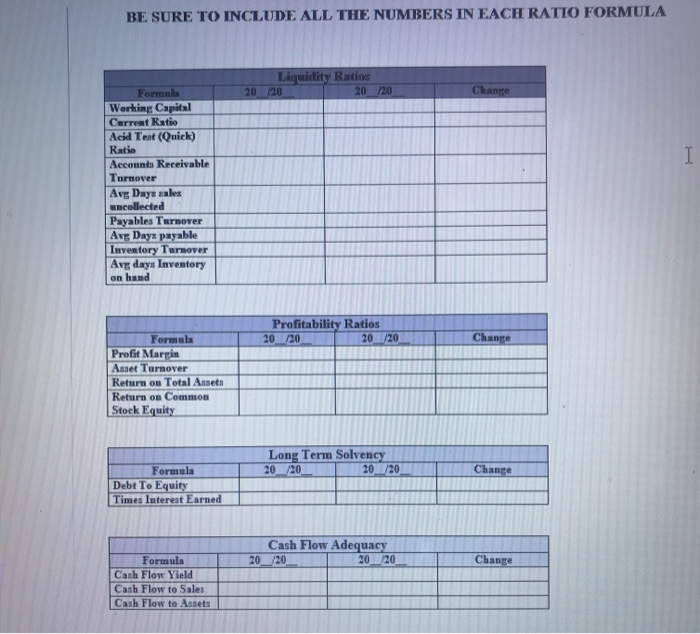
Okay I need help filling out this this chart . Im doing the Company "Kroger" and I was using yahoo and their company's infro but I still cant fill out these charts


SHORT HORIZONTAL ANALYSIS (in Sk) Item Current Year (1/3122020) 10,803,000 429,000 1 Year Prior (1/31/2019) Change Change 11,117,000 347,000 1,589,000 1,637,000 6,346,000 21,635,000 38,118,000 6,059,000 14,274,000 30,283,000 1,918,000 6,533,000 21,071,000 37,197,000 5,858,000 14,197,000 30,292,000 1,918,000 19,681,000 7,886,000 17,007,000 6,931,000 Current Assets Cash Marketable Securities Net Receivable Quick Assets Inventary Prop, Plant & Equipment Total Assets Accounts Payable Current Liabilities Total Liabilities Common Stock Paid In Capital Retained Earnings Total Stockholder's Equity Dividends declared on Corrman Stock # of Shares Outstanding Market value per share Total Revenues (Net Sales) Cost of Goods Sold Income before Income Tax Interest Expense Net Income Cash Flow from Operations Purchases of Plant Assets Sales of Plant Assets Purchase of Investments Sale of investments Loan received Loan regaid Stock Sold Stock repurchased Change in casa Eamings Per Share Book Value per share 122,286,000 121,162,000 605,000 1,659,000 4.664,000 620,0001659 1,640,000 4,164,000 0 0 0 0 BE SURE TO INCLUDE ALL THE NUMBERS IN EACH RATTO FORMULA Liquidity Ratios 2020 20/20 I Format Working Capital Current Ratio Acid Tent (Quick) Ratio Accounts Receivable Turnover Avg Days sales umcollected Payables Turnover Avg Days payable Luventory Turnover Avg daya Inventory on hand Profitability Ratios 20/20 20/20 Change Formula Profit Marpin Asset Turnover Return on Total Assets Return on Common Stock Equity Long Term Solvency 20_/20 20/20 Change Formula Debt To Equity Times Interest Earned Cash Flow Adequacy 20/20 20_20 Change Formula Cash Flow Yield Cash Flow to Sales Cash Flow to Assets SHORT HORIZONTAL ANALYSIS (in Sk) Item Current Year (1/3122020) 10,803,000 429,000 1 Year Prior (1/31/2019) Change Change 11,117,000 347,000 1,589,000 1,637,000 6,346,000 21,635,000 38,118,000 6,059,000 14,274,000 30,283,000 1,918,000 6,533,000 21,071,000 37,197,000 5,858,000 14,197,000 30,292,000 1,918,000 19,681,000 7,886,000 17,007,000 6,931,000 Current Assets Cash Marketable Securities Net Receivable Quick Assets Inventary Prop, Plant & Equipment Total Assets Accounts Payable Current Liabilities Total Liabilities Common Stock Paid In Capital Retained Earnings Total Stockholder's Equity Dividends declared on Corrman Stock # of Shares Outstanding Market value per share Total Revenues (Net Sales) Cost of Goods Sold Income before Income Tax Interest Expense Net Income Cash Flow from Operations Purchases of Plant Assets Sales of Plant Assets Purchase of Investments Sale of investments Loan received Loan regaid Stock Sold Stock repurchased Change in casa Eamings Per Share Book Value per share 122,286,000 121,162,000 605,000 1,659,000 4.664,000 620,0001659 1,640,000 4,164,000 0 0 0 0 BE SURE TO INCLUDE ALL THE NUMBERS IN EACH RATTO FORMULA Liquidity Ratios 2020 20/20 I Format Working Capital Current Ratio Acid Tent (Quick) Ratio Accounts Receivable Turnover Avg Days sales umcollected Payables Turnover Avg Days payable Luventory Turnover Avg daya Inventory on hand Profitability Ratios 20/20 20/20 Change Formula Profit Marpin Asset Turnover Return on Total Assets Return on Common Stock Equity Long Term Solvency 20_/20 20/20 Change Formula Debt To Equity Times Interest Earned Cash Flow Adequacy 20/20 20_20 Change Formula Cash Flow Yield Cash Flow to Sales Cash Flow to Assets


