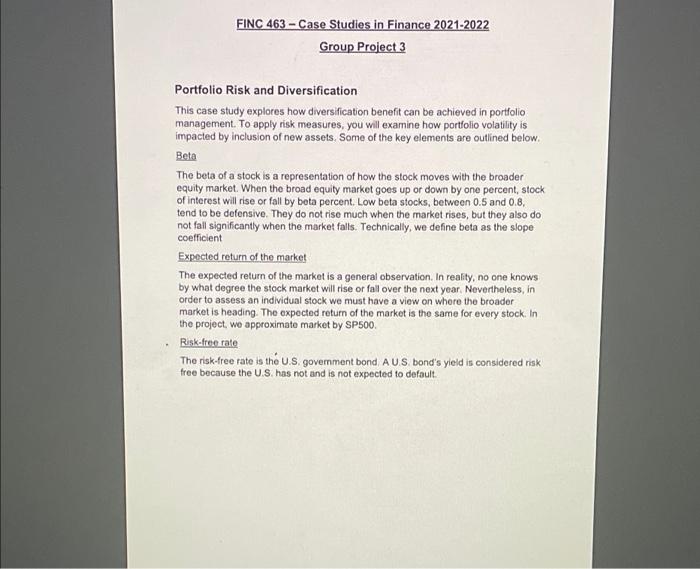
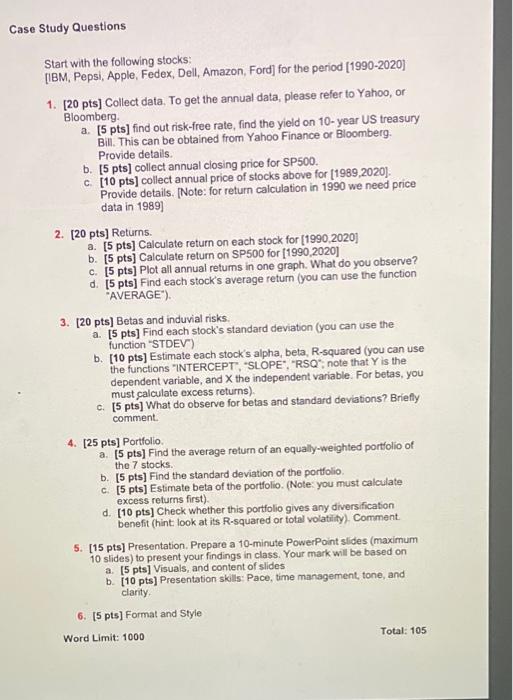
FINC 463 - Case Studies in Finance 2021-2022 Group Project 3 Portfolio Risk and Diversification This case study explores how diversification benefit can be achieved in portfolio management. To apply risk measures, you will examine how portfolio volatility is impacted by inclusion of new assets. Some of the key elements are outlined below. Beta The beta of a stock is a representation of how the stock moves with the broader equity market. When the broad equity market goes up or down by one percent, stock of interest will rise or fall by beta percent. Low beta stocks, between 0.5 and 0.8. tend to be defensive. They do not rise much when the market rises, but they also do not fall significantly when the market falls. Technically, we define beta as the slope coefficient Expected return of the market The expected return of the market is a general observation. In reality, no one knows by what degree the stock market will rise or fall over the next year. Nevertheless, in order to assess an individual stock we must have a view on where the broader market is heading. The expected return of the market is the same for every stock. In the project, we approximate market by SP500 Risk-free rate The risk-free rate is the US government bond AUS bond's yield is considered risk free because the U.S. has not and is not expected to default Case Study Questions Start with the following stocks, [IBM, Pepsi, Apple, Fedex, Dell, Amazon, Ford) for the period (1990-2020 1. [20 pts] Collect data. To get the annual data, please refer to Yahoo, or Bloomberg a. [5 pts] find out risk-free rate, find the yield on 10-year US treasury Bil. This can be obtained from Yahoo Finance or Bloomberg. Provide details b. [5 pts) collect annual closing price for SP500. c. [10 pts) collect annual price of stocks above for (1989,2020). Provide details. (Note: for return calculation in 1990 we need price data in 1989) 2. [20 pts) Returns a. [5 pts] Calculate return on each stock for [1990,2020) b. 5 ptsj Calculate return on SP500 for 1990 2020 c. 15 pts] Plot all annual retums in one graph. What do you observe? d. 15 pts) Find each stock's average return (you can use the function "AVERAGE"). 3. [20 pts) Betas and induvial risks. a. [5 pts) Find each stock's standard deviation (you can use the function "STDEV) b. [10 pts) Estimate each stock's alpha, beta, R-squared (you can use the functions "INTERCEPT, 'SLOPE", "RSQ", note that is the dependent variable, and the independent variable. For betas, you must calculate excess returns). c. 15 pts) What do observe for betas and standard deviations? Briefly comment 4. [25 pts) Portfolio a (5 pts) Find the average return of an equally-weighted portfolio of the 7 stocks. b. [5 pts) Find the standard deviation of the portfolio ci5 pts] Estimate beta of the portfolio. (Note: you must calculate excess returns first) d. [10 pts) Check whether this portfolio gives any diversification benefit (hint look at its R-squared or total volatility). Comment 5. [15 pts) Presentation. Prepare a 10-minute PowerPoint slides (maximum 10 slides) to present your findings in class. Your mark will be based on a. [5 pts] Visuals, and content of slides b. 110 pts) Presentation skills: Pace, time management, tone, and clarity 6. [5 pts] Format and Style Word Limit: 1000 Total: 105 FINC 463 - Case Studies in Finance 2021-2022 Group Project 3 Portfolio Risk and Diversification This case study explores how diversification benefit can be achieved in portfolio management. To apply risk measures, you will examine how portfolio volatility is impacted by inclusion of new assets. Some of the key elements are outlined below. Beta The beta of a stock is a representation of how the stock moves with the broader equity market. When the broad equity market goes up or down by one percent, stock of interest will rise or fall by beta percent. Low beta stocks, between 0.5 and 0.8. tend to be defensive. They do not rise much when the market rises, but they also do not fall significantly when the market falls. Technically, we define beta as the slope coefficient Expected return of the market The expected return of the market is a general observation. In reality, no one knows by what degree the stock market will rise or fall over the next year. Nevertheless, in order to assess an individual stock we must have a view on where the broader market is heading. The expected return of the market is the same for every stock. In the project, we approximate market by SP500 Risk-free rate The risk-free rate is the US government bond AUS bond's yield is considered risk free because the U.S. has not and is not expected to default Case Study Questions Start with the following stocks, [IBM, Pepsi, Apple, Fedex, Dell, Amazon, Ford) for the period (1990-2020 1. [20 pts] Collect data. To get the annual data, please refer to Yahoo, or Bloomberg a. [5 pts] find out risk-free rate, find the yield on 10-year US treasury Bil. This can be obtained from Yahoo Finance or Bloomberg. Provide details b. [5 pts) collect annual closing price for SP500. c. [10 pts) collect annual price of stocks above for (1989,2020). Provide details. (Note: for return calculation in 1990 we need price data in 1989) 2. [20 pts) Returns a. [5 pts] Calculate return on each stock for [1990,2020) b. 5 ptsj Calculate return on SP500 for 1990 2020 c. 15 pts] Plot all annual retums in one graph. What do you observe? d. 15 pts) Find each stock's average return (you can use the function "AVERAGE"). 3. [20 pts) Betas and induvial risks. a. [5 pts) Find each stock's standard deviation (you can use the function "STDEV) b. [10 pts) Estimate each stock's alpha, beta, R-squared (you can use the functions "INTERCEPT, 'SLOPE", "RSQ", note that is the dependent variable, and the independent variable. For betas, you must calculate excess returns). c. 15 pts) What do observe for betas and standard deviations? Briefly comment 4. [25 pts) Portfolio a (5 pts) Find the average return of an equally-weighted portfolio of the 7 stocks. b. [5 pts) Find the standard deviation of the portfolio ci5 pts] Estimate beta of the portfolio. (Note: you must calculate excess returns first) d. [10 pts) Check whether this portfolio gives any diversification benefit (hint look at its R-squared or total volatility). Comment 5. [15 pts) Presentation. Prepare a 10-minute PowerPoint slides (maximum 10 slides) to present your findings in class. Your mark will be based on a. [5 pts] Visuals, and content of slides b. 110 pts) Presentation skills: Pace, time management, tone, and clarity 6. [5 pts] Format and Style Word Limit: 1000 Total: 105


