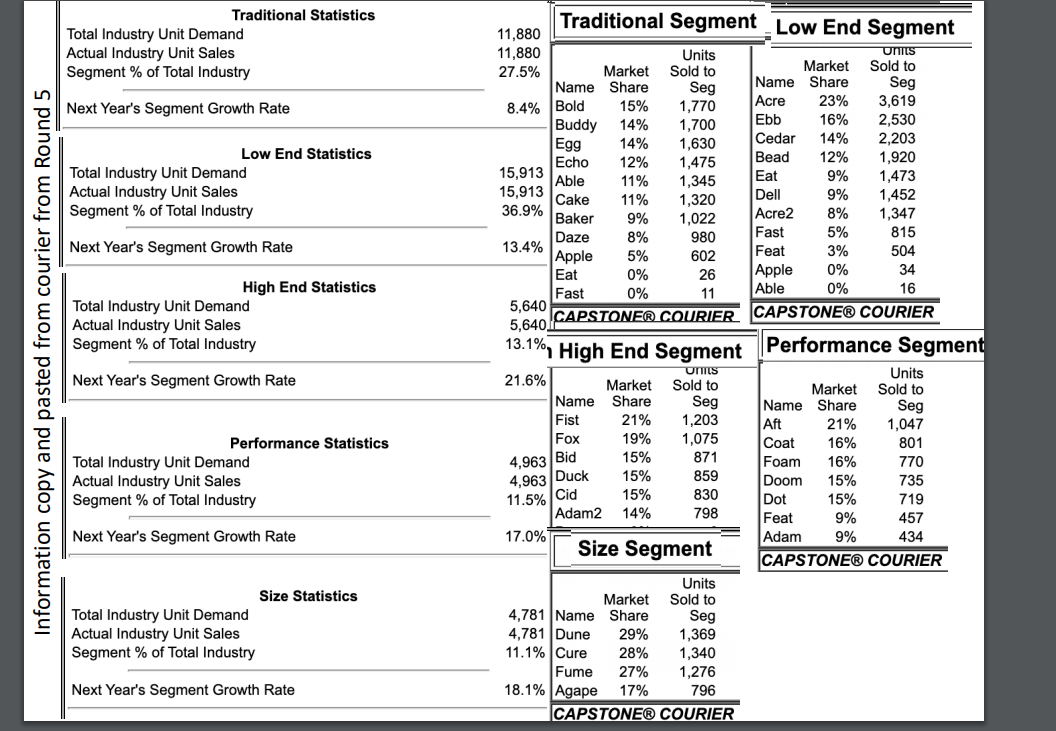
Find a description of the assignment and guidelines in this pictures.
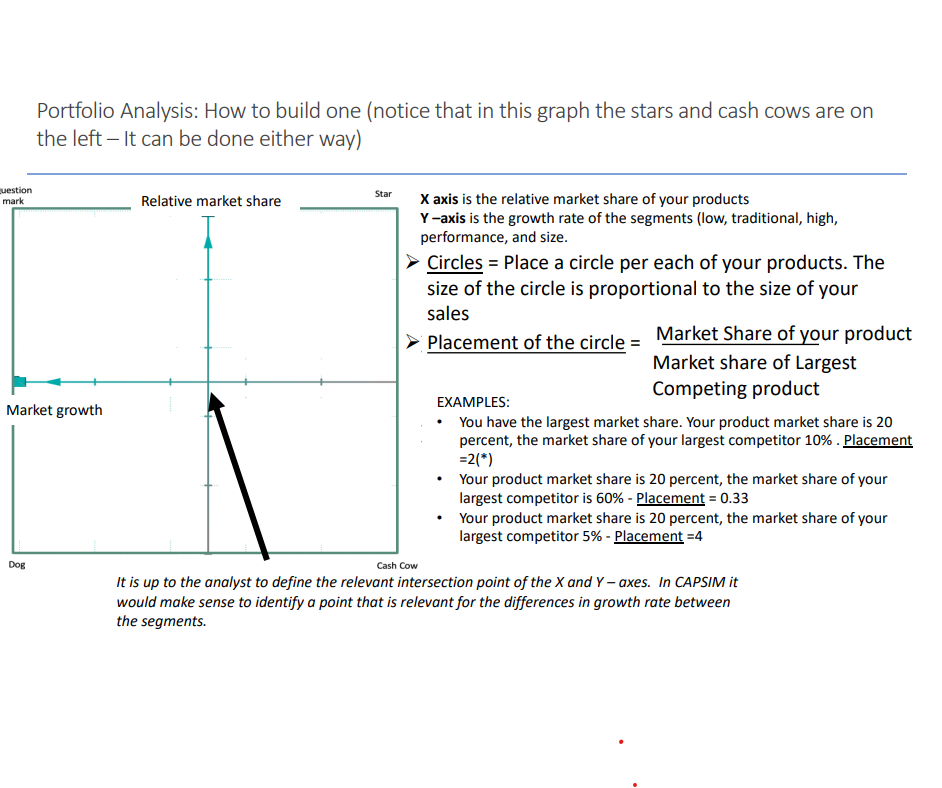
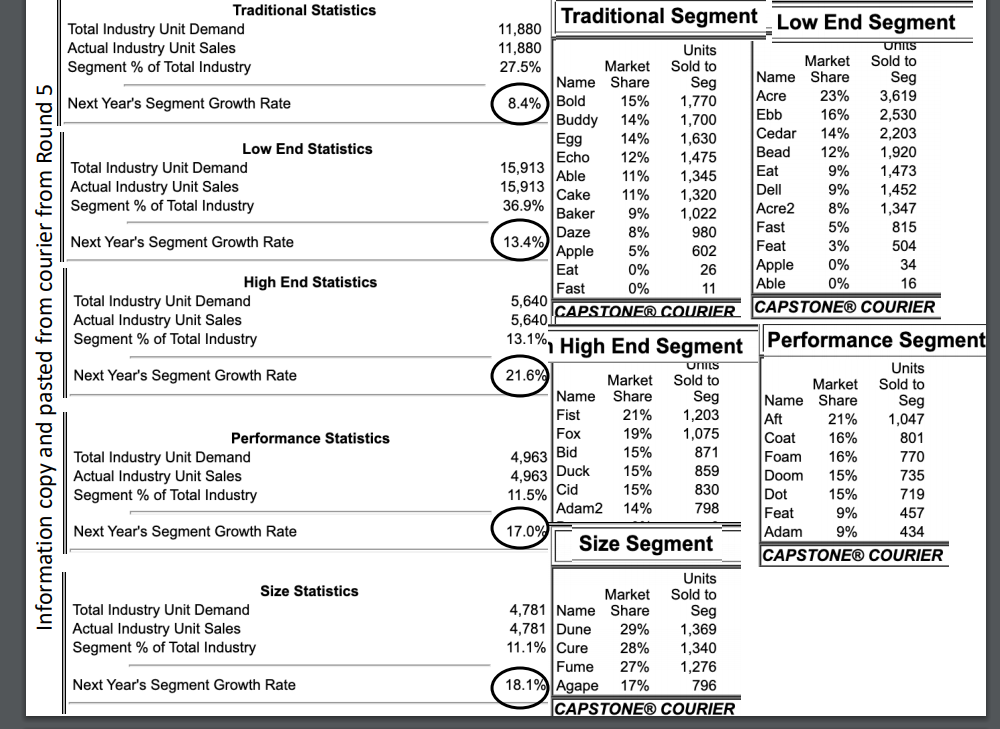
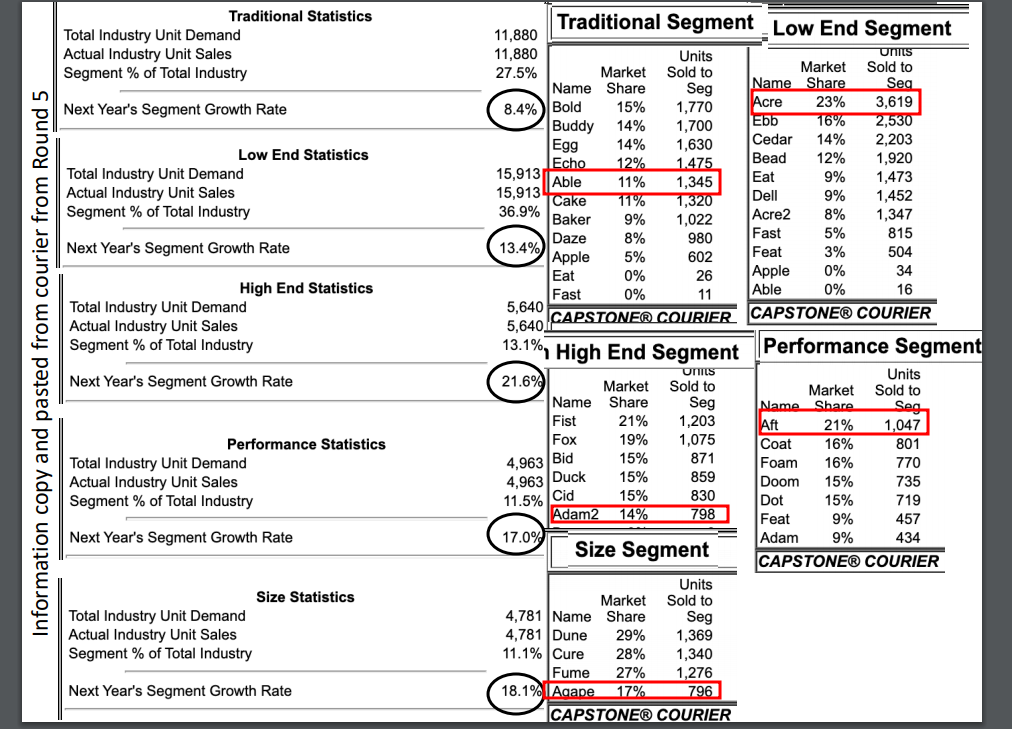
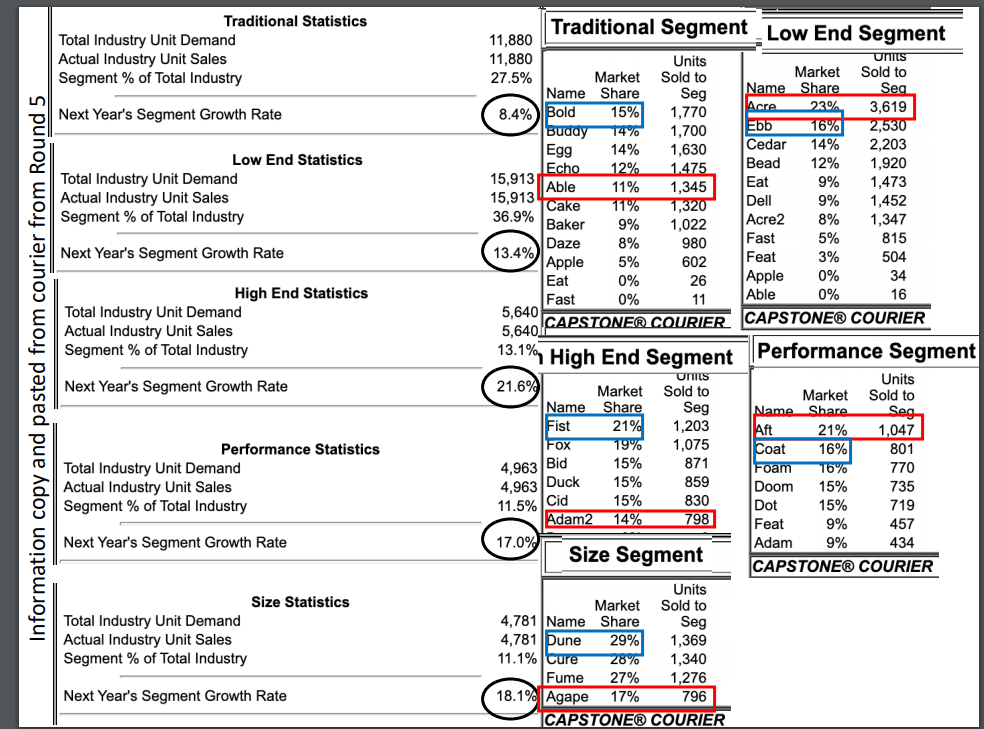
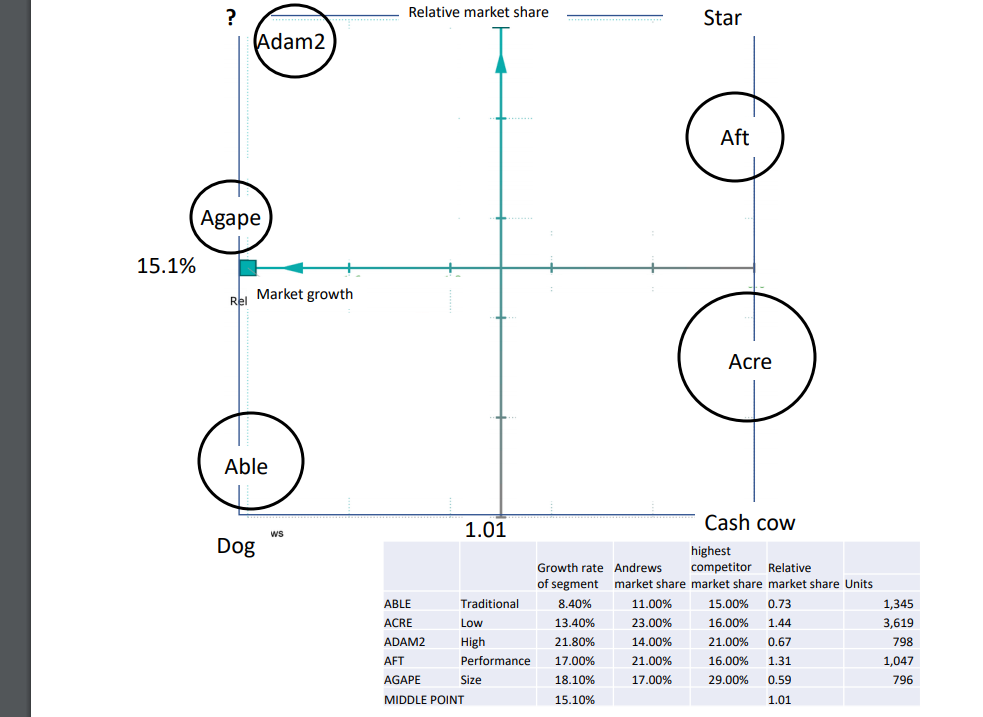
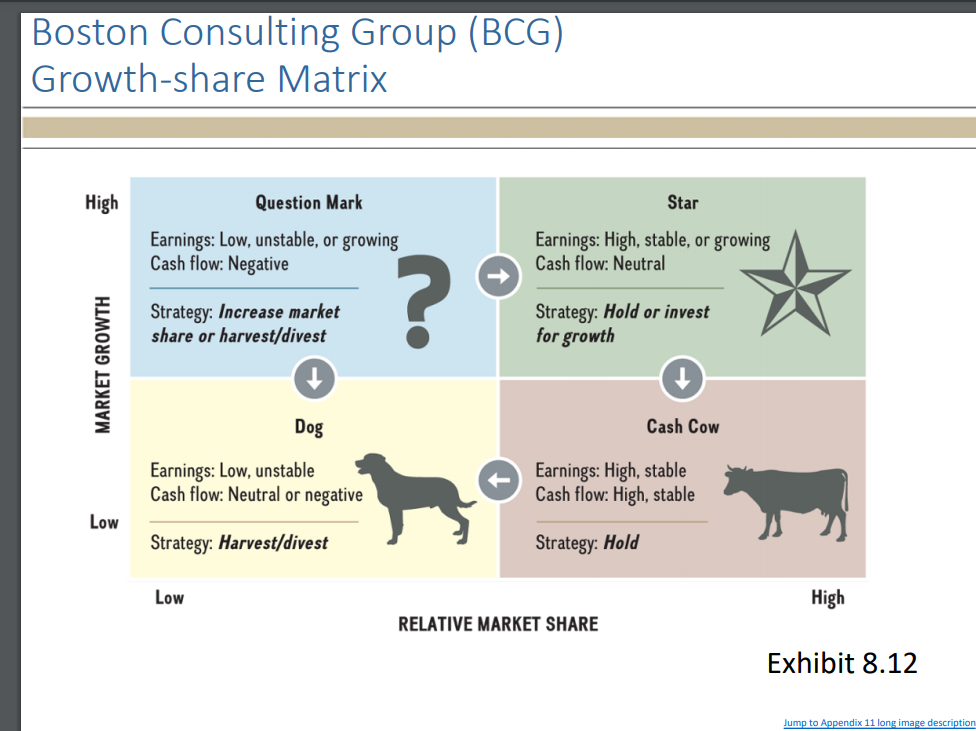
Portfolio Analysis: How to build one (notice that in this graph the stars and cash cows are on the left - It can be done either way) vestion mark Relative market share Star X axis is the relative market share of your products Y -axis is the growth rate of the segments (low, traditional, high, performance, and size. > Circles = Place a circle per each of your products. The size of the circle is proportional to the size of your sales Placement of the circle = Market Share of your product Market share of Largest EXAMPLES: Competing product Market growth You have the largest market share. Your product market share is 20 percent, the market share of your largest competitor 10% . Placement =2(* ) Your product market share is 20 percent, the market share of your largest competitor is 60% - Placement = 0.33 Your product market share is 20 percent, the market share of your largest competitor 5% - Placement =4 DOE Cash Cow It is up to the analyst to define the relevant intersection point of the X and Y - axes. In CAPSIM it would make sense to identify a point that is relevant for the differences in growth rate between the segments.Homework: Use the ECG matrix to evaluate your products after Round 5 1. Following the model identify the size and placement of each of your products. 2. Provide your diagnosis answer the following three questions: - What products deserve the most attention? - Which products you think may require retiring? - Which products may require investment? \fTraditional Statistics Total Industry Unit Demand 11,880 Traditional Segment Low End Segment Actual Industry Unit Sales 11,880 Units Units Segment % of Total Industry 27.5% Market Sold to Market Sold to Share Name Seg Information copy and pasted from courier from Round 5 Name Seg Share Next Year's Segment Growth Rate 8.4% Bold 15% 1,770 Acre 23% 3,619 Buddy 14% 1,700 Ebb 16% 2,530 14% 1,630 Cedar 14% 2,203 Low End Statistics Egg 15,913 Echo 12% 1,475 Bead 12% 1,920 Total Industry Unit Demand 15,913 Able 11% 1,345 Eat 9% 1,473 Actual Industry Unit Sales Cake 11% 1,320 Dell 9% 1,452 Segment % of Total Industry 36.9% Baker 9% 1,022 Acre2 8% 1,347 13.4% Daze 8% 980 Fast 5% 815 Next Year's Segment Growth Rate Apple 5% 602 Feat 3% 504 Eat 0% 26 Apple 0% 34 High End Statistics 11 Able 0% 16 Total Industry Unit Demand 5,640 Fast 5,640 CAPSTONED COURIER CAPSTONE@ COURIER Actual Industry Unit Sales Segment % of Total Industry 13.1%, High End Segment |Performance Segment OTIS Next Year's Segment Growth Rate 21.6% Market Units Sold to Market Sold to Name Share Seg Name Share Seg Fist 21% 1,203 Aft 21% 1,047 Performance Statistics Fox 19% 1,075 Coat 16% 801 Total Industry Unit Demand 4,963 Bid 15% 871 Foam 16% 770 Actual Industry Unit Sales 4,963 Duck 15% 859 Doom 15% 735 Segment % of Total Industry 11.5% Cid 15% 830 Dot 15% 719 Adam2 14% 798 Feat 9% 457 Next Year's Segment Growth Rate 17.0% Size Segment Adam 9% 434 CAPSTONE@ COURIER Units Size Statistics Market Sold to Total Industry Unit Demand 4,781 Name Share Seg Actual Industry Unit Sales 4,781 Dune 29% 1,369 Segment % of Total Industry 11.1% Cure 28% 1,340 Fume 27% 1,276 Next Year's Segment Growth Rate 18.1% Agape 17% 796 CAPSTONE@ COURIERTraditional Statistics Total Industry Unit Demand 11,880 Traditional Segment Low End Segment Actual Industry Unit Sales 11,880 Units Segment % of Total Industry 27.5% Market Sold to Market Sold to Information copy and pasted from courier from Round 5 Name Share Seg Name Share Seg Next Year's Segment Growth Rate 8.4% Bold 15% 1,770 Acre 23% 3,619 Buddy 14% 1,700 Ebb 16% 2,530 Low End Statistics Egg 14% 1,630 Cedar 14% 2,203 Total Industry Unit Demand 15,913 Echo 12% 1,475 Bead 12% 1,920 Eat 9% 1,473 Actual Industry Unit Sales 15,913 Able 11% 1,345 Segment % of Total Industry 36.9% Cake 11% 1,320 Dell 9% 1,452 Baker 9% 1,022 Acre2 8% 1,347 Next Year's Segment Growth Rate 13.4% Daze 8% 980 Fast 5% 815 Apple 5% 602 Feat 3% 504 Eat 0% 26 Apple 0% 34 High End Statistics Fast 0% 11 Able 0% 16 Total Industry Unit Demand 5,640 Actual Industry Unit Sales 5,640 CAPSTONED COURIER CAPSTONE@ COURIER Segment % of Total Industry 13.1%, High End Segment Performance Segment Next Year's Segment Growth Rate 21.6% OTIS Market Units Sold to Sold to Name Share Market Seg Name Share Seg Fist 21% 1,203 Aft 21% 1,047 Performance Statistics Fox 19% 1,075 Coat 16% 801 Total Industry Unit Demand 4,963 Bid 15% 871 Foam 16% 770 Actual Industry Unit Sales 4,963 Duck 15% 859 Doom 15% 735 Segment % of Total Industry 11.5% Cid 15% 830 Dot 15% 719 Adam2 14% 798 Feat 9% 457 Next Year's Segment Growth Rate 17.0% Size Segment Adam 9% 434 CAPSTONE@ COURIER Size Statistics Units Market Sold to Total Industry Unit Demand 4,781 Name Share Seg Actual Industry Unit Sales 4,781 Dune 29% 1,369 Segment % of Total Industry 11.1% Cure 28% 1,340 Fume 27% 1,276 Next Year's Segment Growth Rate 18.1%) Agape 17% 796 CAPSTONE@ COURIERTraditional Statistics Total Industry Unit Demand 11,880 Traditional Segment Low End Segment Actual Industry Unit Sales 11,880 Units Units Segment % of Total Industry 27.5% Market Sold to Market Sold to Share Seg Name Share Sea Information copy and pasted from courier from Round 5 Name Next Year's Segment Growth Rate 8.4% Bold 15% 1,770 Acre 23% 3,619 Buddy 14% 1,700 Ebb 16% 2,530 Low End Statistics Egg 14% 1,630 Cedar 14% 2,203 Echo 12% 1.475 Bead 12% 1,920 Total Industry Unit Demand 15,913 Able 11% 1,345 Eat 9% 1,473 Actual Industry Unit Sales 15,913 Dell 9% 1,452 Segment % of Total Industry 36.9% Cake 11% 1,320 Baker 9% 1,022 Acre2 8% 1,347 Daze 8% 980 Fast 5% 815 Next Year's Segment Growth Rate 13.4% Apple 5% 602 Feat 3% 504 Eat 0% 26 Apple 0% 34 High End Statistics 5,640 Fast 0% 11 Able 0% 16 Total Industry Unit Demand Actual Industry Unit Sales 5,640 CAPSTONED COURIER CAPSTONE@ COURIER Segment % of Total Industry 13.1%, High End Segment Performance Segment Next Year's Segment Growth Rate 21.6% OTIS Market Sold to Units Name Share Seg Market Sold to Name Share Seg Fist 21% 1,203 Aft 21% 1,047 Performance Statistics Fox 19% 1,075 Coat 16% 801 Total Industry Unit Demand 4,963 Bid 15% 871 Foam 16% 770 Actual Industry Unit Sales 4,963 Duck 15% 859 Doom 15% 735 Segment % of Total Industry 11.5% Cid 15% 830 Dot 15% 719 Adam2 14% 798 Feat 9% 457 Next Year's Segment Growth Rate 17.0% Size Segment Adam 9% 434 CAPSTONE@ COURIER Units Size Statistics Market Sold to Total Industry Unit Demand 4,781 Name Share Seg Actual Industry Unit Sales 4,781 Dune 29% 1,369 Segment % of Total Industry 11.1% Cure 28% 1,340 Fume 27% 1,276 Next Year's Segment Growth Rate 18.1% Agape 17% 796 CAPSTONE@ COURIERTraditional Statistics Total Industry Unit Demand 11,880 Traditional Segment Low End Segment Actual Industry Unit Sales 11,880 Units UnitS Segment % of Total Industry 27.5% Market Sold to Market Sold to Seg Name Share Sec Information copy and pasted from courier from Round 5 Name Share Next Year's Segment Growth Rate 8.4% Bold 15% 1,770 Acre 23% 3,619 Buddy 14% 1,700 16% 2,530 Egg 14% 1,630 Cedar 14% 2,203 Low End Statistics Echo 12% 1.475 Bead 12% 1,920 Total Industry Unit Demand 15,913 15,913 Able 11% 1,345 Eat 9% 1,473 Actual Industry Unit Sales Dell 1,452 36.9% Cake 11% 1,320 9% Segment % of Total Industry Baker 9% 1,022 Acre2 8% 1,347 Fast 5% 815 Next Year's Segment Growth Rate 13.4% Daze 8% 980 Apple 5% 602 Feat 3% 504 Eat 26 Apple 0% 34 High End Statistics Fast 0% 11 Able 0% 16 Total Industry Unit Demand 5,640 Actual Industry Unit Sales 5,640 CAPSTONED COURIER CAPSTONE@ COURIER Segment % of Total Industry 13.1% High End Segment Performance Segment Next Year's Segment Growth Rate 21.6% OTTS Units Market Sold to Market Sold to Name Share Seg Name Share Fist 21% 1,203 Af 21% 1,047 Performance Statistics FOX 19% 1,075 Coat 16% 801 Total Industry Unit Demand 4,963 Bid 15% 871 Foam 16% 770 Actual Industry Unit Sales 4,963 Duck 15% 859 Doom 15% 735 Segment % of Total Industry 11.5% Cid 15% 830 Dot 15% 719 Adam2 14% 798 Feat 9% 457 Next Year's Segment Growth Rate 17.0% Size Segment Adam 9% 434 CAPSTONE@ COURIER Units Size Statistics Market Sold to Total Industry Unit Demand 4,781 Name Share Seg Actual Industry Unit Sales 4,781 Dune 29% 1,369 Segment % of Total Industry 11.1% Cure 28% 1,340 Fume 27% 1,276 Next Year's Segment Growth Rate 18.1% Agape 17% 796 CAPSTONER COURIER? Relative market share Star Adam2 Aft Agape 15.1% Rel Market growth Acre Able Dog wS 1.01 Cash cow highest Growth rate Andrews competitor Relative of segment market share market share market share Units ABLE Traditional 8.40% 11.00% 15.00% 0.73 1,345 ACRE Low 13.40% 23.00% 16.00% 1.44 3,619 ADAM2 High 21.80% 14.00% 21.00% 0.67 798 AFT Performance 17.00% 21.00% 16.00% 1.31 1,047 AGAPE Size 18.10% 17.00% 29.00% 0.59 796 MIDDLE POINT 15.10% 1.01Boston Consulting Group (BCG) Growth-share Matrix High Question Mark Star Earnings: Low, unstable, or growing Earnings: High, stable, or growing Cash flow: Negative Cash flow: Neutral MARKET GROWTH Strategy: Increase market Strategy: Hold or invest share or harvest/divest for growth Dog Cash Cow Earnings: Low, unstable Earnings: High, stable Cash flow: Neutral or negative Cash flow: High, stable Low Strategy: Harvest/divest Strategy: Hold Low High RELATIVE MARKET SHARE Exhibit 8.12 Jump to Appendix 11 long image description