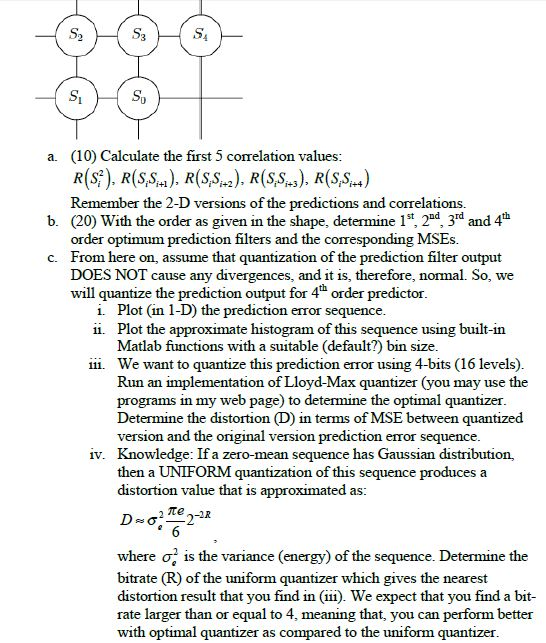
Find and download the 256x256 gray scale lena image. Subtract 128 from the pixel values and make it a zero-mean process. We will experiment with optimum linear prediction. The image predictor uses the following template with 4 coefficients to predict the pixel at location ??0:

S. S. a. (10) Calculate the first 5 correlation values Remember the 2-D versions of the predictions and correlations. b. (20) With the order as given in the shape, det1t 22d, 3rd and 4'h order optimum prediction filters and the corresponding MSEs. From here on, assume that quantization of the prediction filter output DOES NOT cause any divergences, and it is, therefore, normal. So, we will quantize the prediction output for 4th order predictor c. Plot (in 1-D) the prediction error sequence Plot the approximate histogram of this sequence using built-in Matlab functions with a suitable (default?) bin size We want to quantize this prediction error using 4-bits (16 levels) Run an implementation of Lloyd-Max quantizer (you may use the programs in my web page) to determine the optimal quantizer Determine the distortion (D) in terms of MSE between quantized version and the original version prediction error sequence Knowledge: If a zero-mean sequence has Gaussian distribution, then a UNIFORM quantization of this sequence pr distortion value that is approximated as i. ii. iii. iv. te where ?, is the variance (energy) of the sequence. Determine the bitrate (R) of the uniform quantizer which gives the nearest distortion result that you find in (ii). We expect that you find a bit rate larger than or equal to 4, meaning that, you can perform better with optimal quantizer as compared to the uniform quantizei S. S. a. (10) Calculate the first 5 correlation values Remember the 2-D versions of the predictions and correlations. b. (20) With the order as given in the shape, det1t 22d, 3rd and 4'h order optimum prediction filters and the corresponding MSEs. From here on, assume that quantization of the prediction filter output DOES NOT cause any divergences, and it is, therefore, normal. So, we will quantize the prediction output for 4th order predictor c. Plot (in 1-D) the prediction error sequence Plot the approximate histogram of this sequence using built-in Matlab functions with a suitable (default?) bin size We want to quantize this prediction error using 4-bits (16 levels) Run an implementation of Lloyd-Max quantizer (you may use the programs in my web page) to determine the optimal quantizer Determine the distortion (D) in terms of MSE between quantized version and the original version prediction error sequence Knowledge: If a zero-mean sequence has Gaussian distribution, then a UNIFORM quantization of this sequence pr distortion value that is approximated as i. ii. iii. iv. te where ?, is the variance (energy) of the sequence. Determine the bitrate (R) of the uniform quantizer which gives the nearest distortion result that you find in (ii). We expect that you find a bit rate larger than or equal to 4, meaning that, you can perform better with optimal quantizer as compared to the uniform quantizei


