Question
Find and use annual reports for Yum brands along with any other sources you believe would be reputable and relevant to this project. It should
Find and use annual reports for Yum brands along with any other sources you believe would be reputable and relevant to this project. It should be based on your analysis of the company’s financial statements and other sources. Refer to and use all of the following from annual reports and/or 10-K filings to include:
- Company’s financial statements (Income statement, Balance sheet, Cash flow, Stockholders’ Equity).
- The identified risks are addressed in the annual reports.
- The Management Discussion & Analysis (MD&A) section.
- The notes to the financial statements are addressed in the annual reports.
- A balance sheet with a particular focus on Goodwill/Intangible Assets.
- External auditor’s assessment re. the quality of the company’s financial accounting/reporting.
- Any other sections of the annual report that you believe are relevant to your analysis.
You must extract all financial information regarding the companies you analyze from their annual reports and calculate the relevant ratios independently. Do not base these ratios on how someone else has calculated them. Some key elements (but not an all-inclusive list) to this analysis follow:
- Evaluate the following over a minimum of at least the past 5 years:
- ROI performance
- Liquidity
- Critical working capital/PP&E turnover efficiency
- Overall Balance sheet efficiency
- Market perception/valuation of the companies
- Dividend payout comparison
- Debt ratios
- Cash flow performance (Operating, Investing, Financing, & Free Cash Flow)
- Cash Conversion Cycle
- Profitability performance/efficiency
- Goodwill
- Common size and/or horizontal analysis for each company addressing key elements within the companies:
- Income statement
- Balance sheet
- Provide a separate schedule showing the basis for each of these calculations.
below are financial statements from Yum Brands
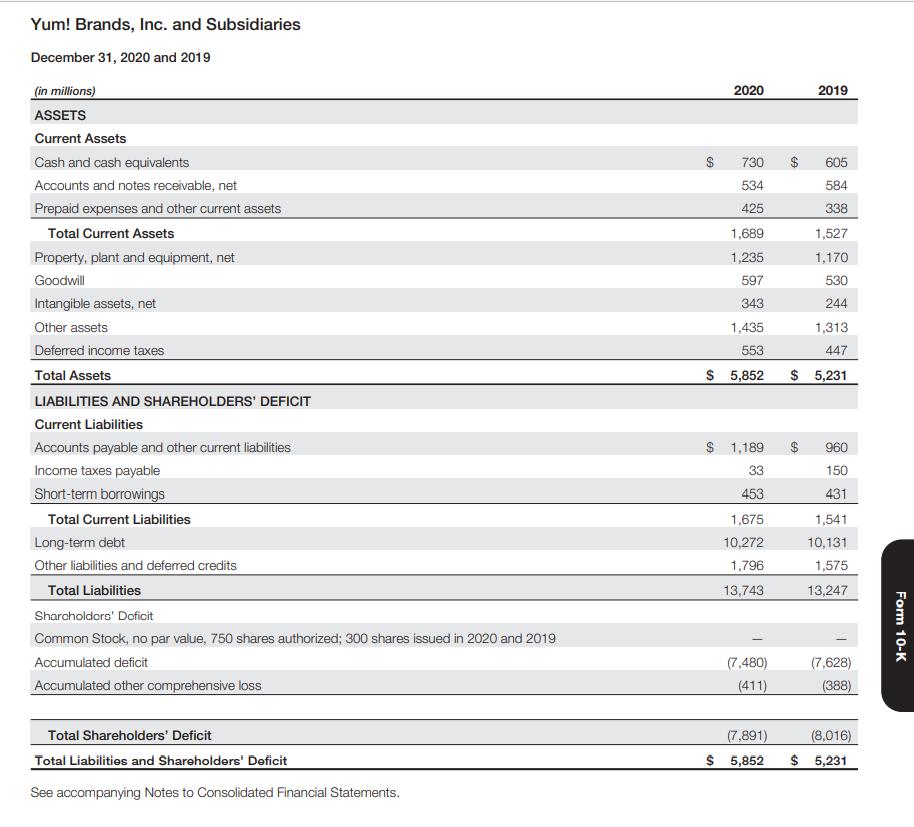
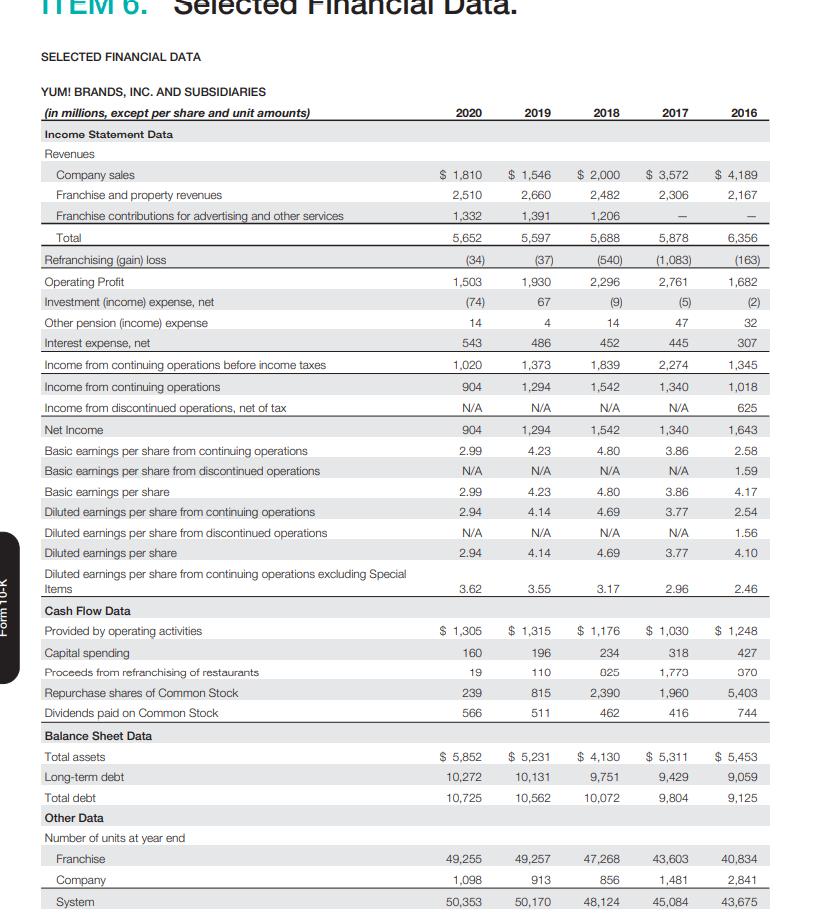
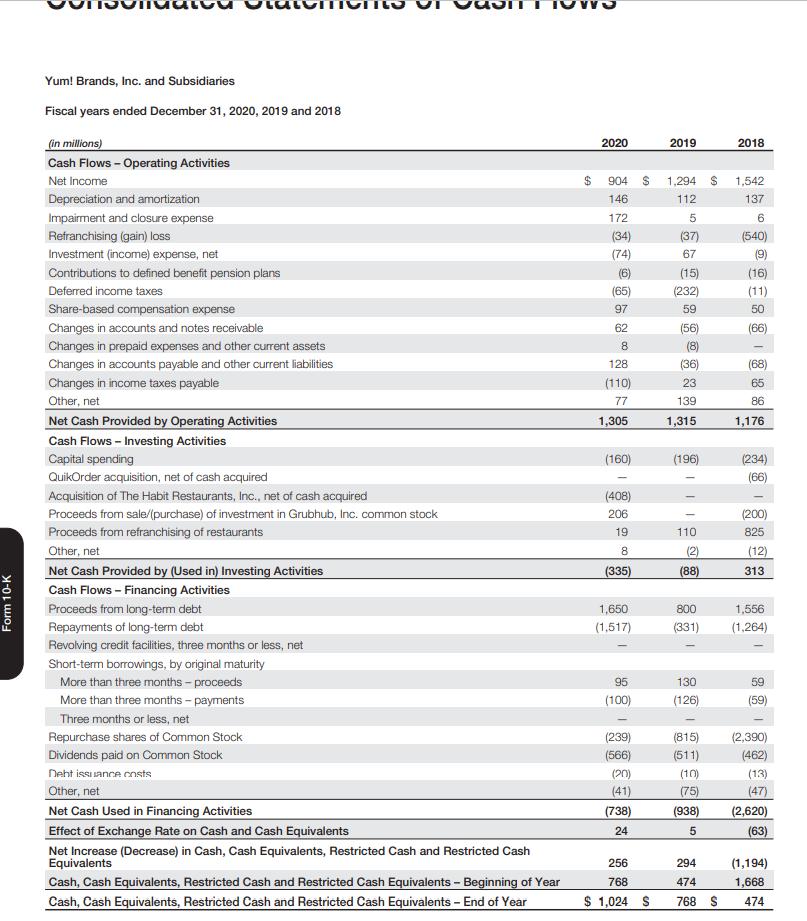
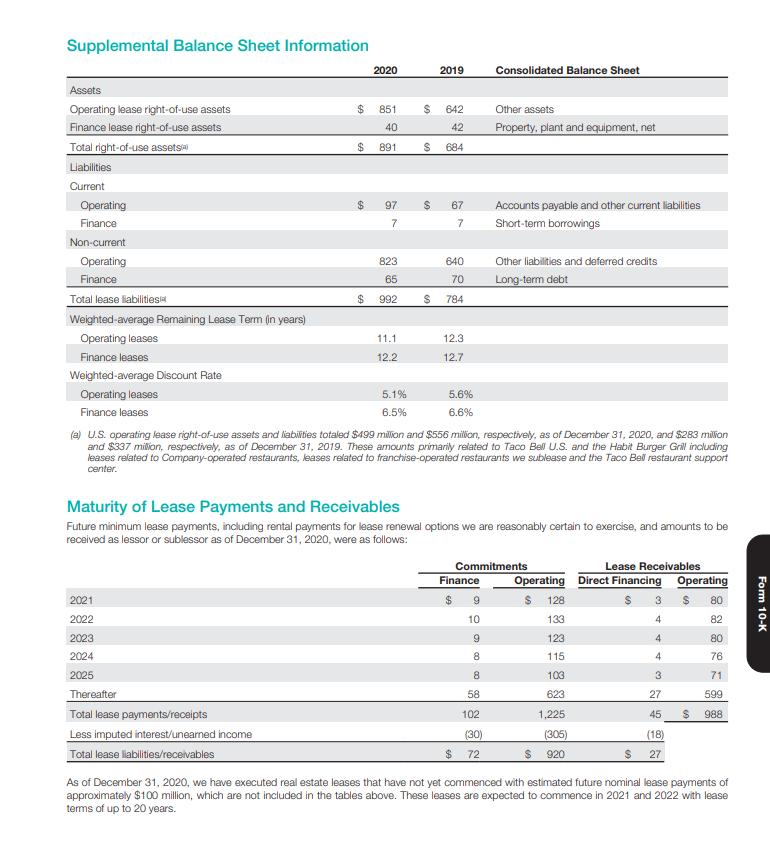
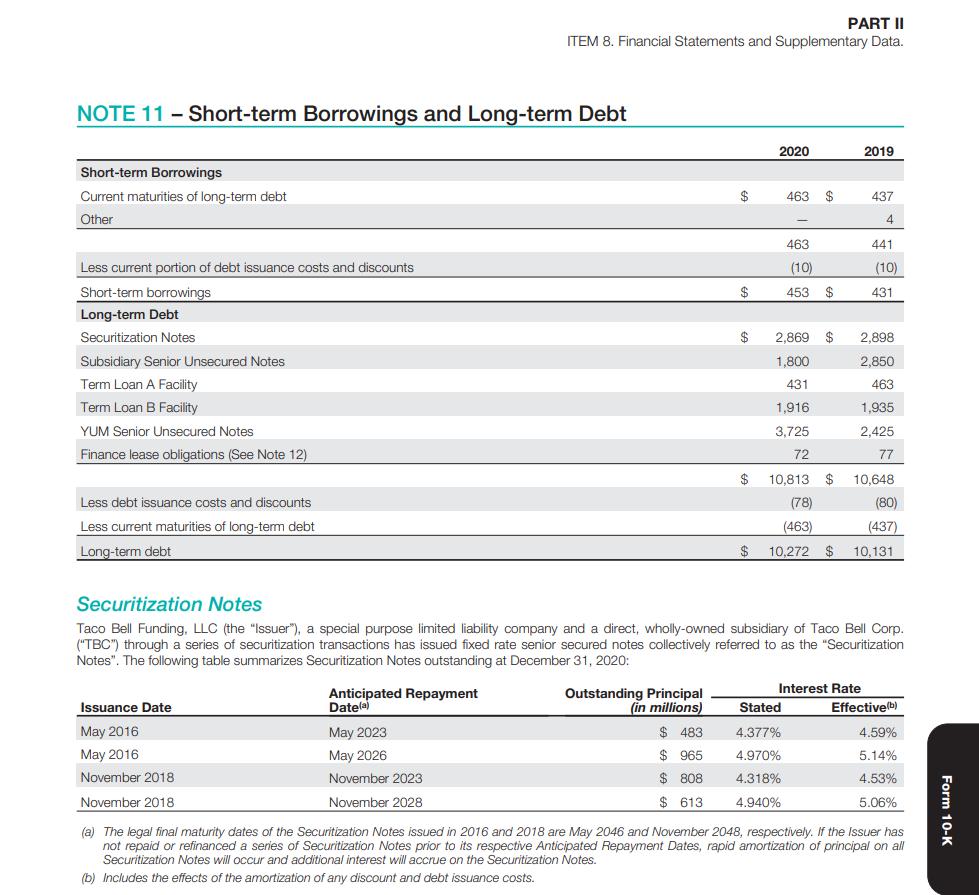
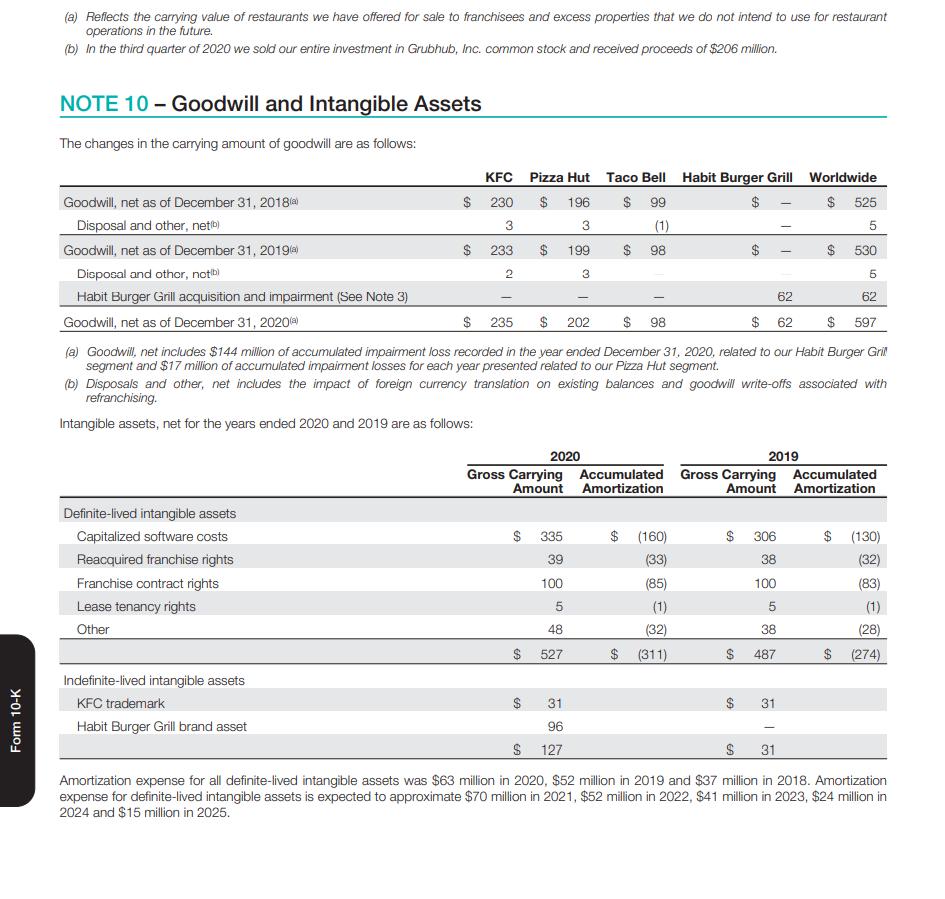
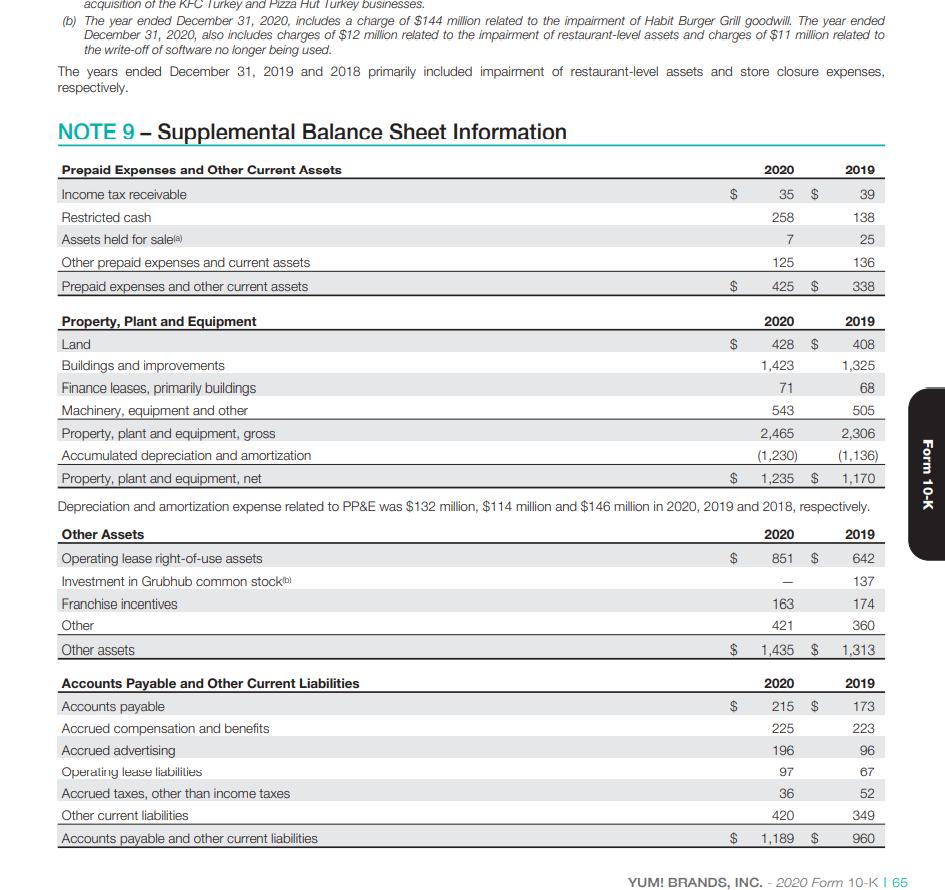
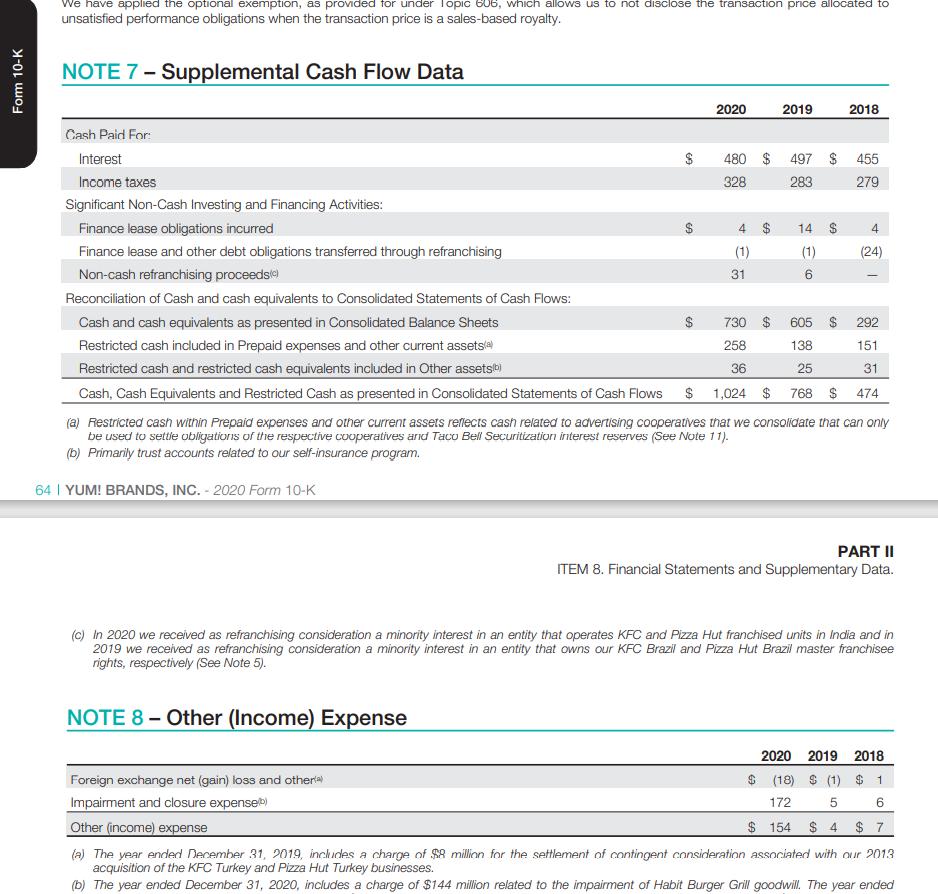
Yum! Brands, Inc. and Subsidiaries December 31, 2020 and 2019 (in millions) ASSETS Current Assets 2020 2019 Cash and cash equivalents 730 605 Accounts and notes receivable, net 534 584 Prepaid expenses and other current assets 425 338 Total Current Assets 1,689 1,527 Property, plant and equipment, net 1,235 1,170 Goodwill 597 530 Intangible assets, net 3431 244 Other assets 1,435 1,313 Deferred income taxes 553 447 Total Assets LIABILITIES AND SHAREHOLDERS' DEFICIT $ 5,852 $ 5,231 Current Liabilities Accounts payable and other current liabilities Income taxes payable Short-term borrowings Total Current Liabilities Long-term debt Other liabilities and deferred credits Total Liabilities Shareholders' Deficit Common Stock, no par value, 750 shares authorized; 300 shares issued in 2020 and 2019 Accumulated deficit Accumulated other comprehensive loss Total Shareholders' Deficit Total Liabilities and Shareholders' Deficit See accompanying Notes to Consolidated Financial Statements. $ 1,189 960 33 150 453 431 1,675 1,541 10,272 10,131 1,796 1,575 13,743 13,247 (7,480) (411) (7,628) (388) (7,891) $ 5,852 (8,016) $ 5,231 Form 10-K
Step by Step Solution
3.48 Rating (165 Votes )
There are 3 Steps involved in it
Step: 1
Total assets for Yum Brands Inc and Subsidiaries were 5852 million in 2020 and 5231 million in 2019 Total liabilities were 13741 million in 2020 and 13247 million in 2019 Shareholders deficit was 7891 ...
Get Instant Access to Expert-Tailored Solutions
See step-by-step solutions with expert insights and AI powered tools for academic success
Step: 2

Step: 3

Ace Your Homework with AI
Get the answers you need in no time with our AI-driven, step-by-step assistance
Get Started


