Question
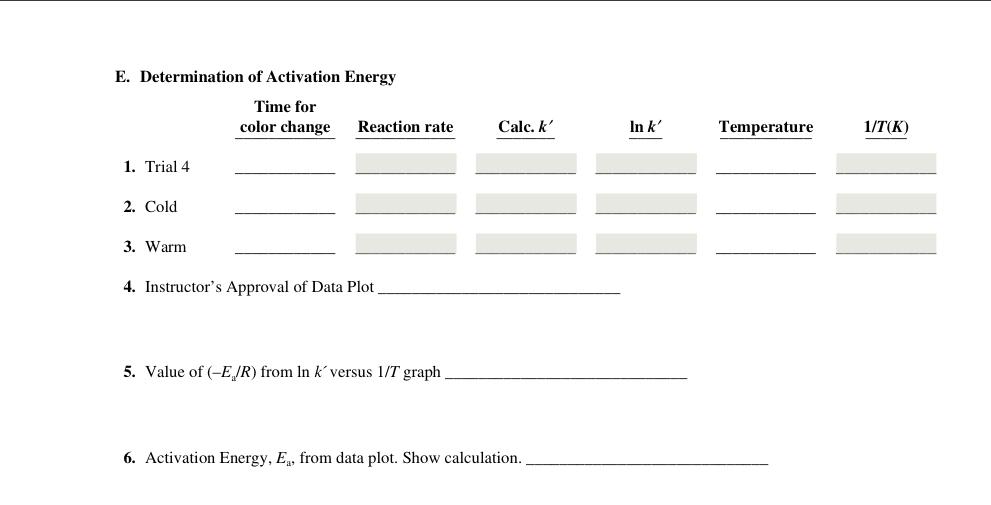
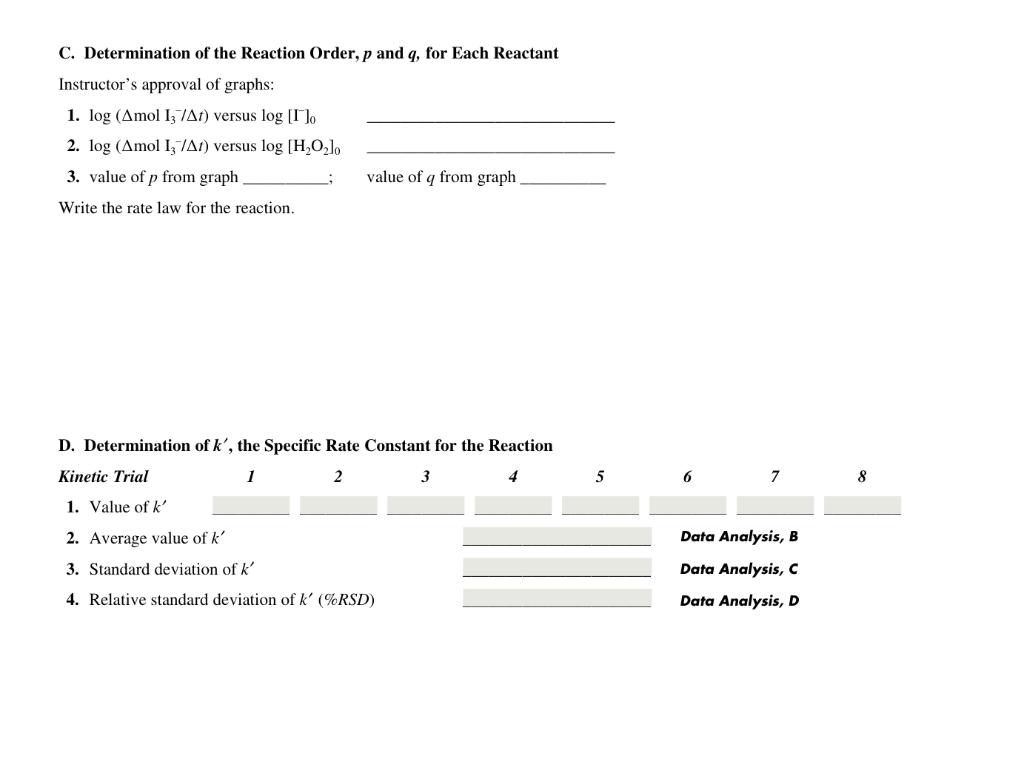
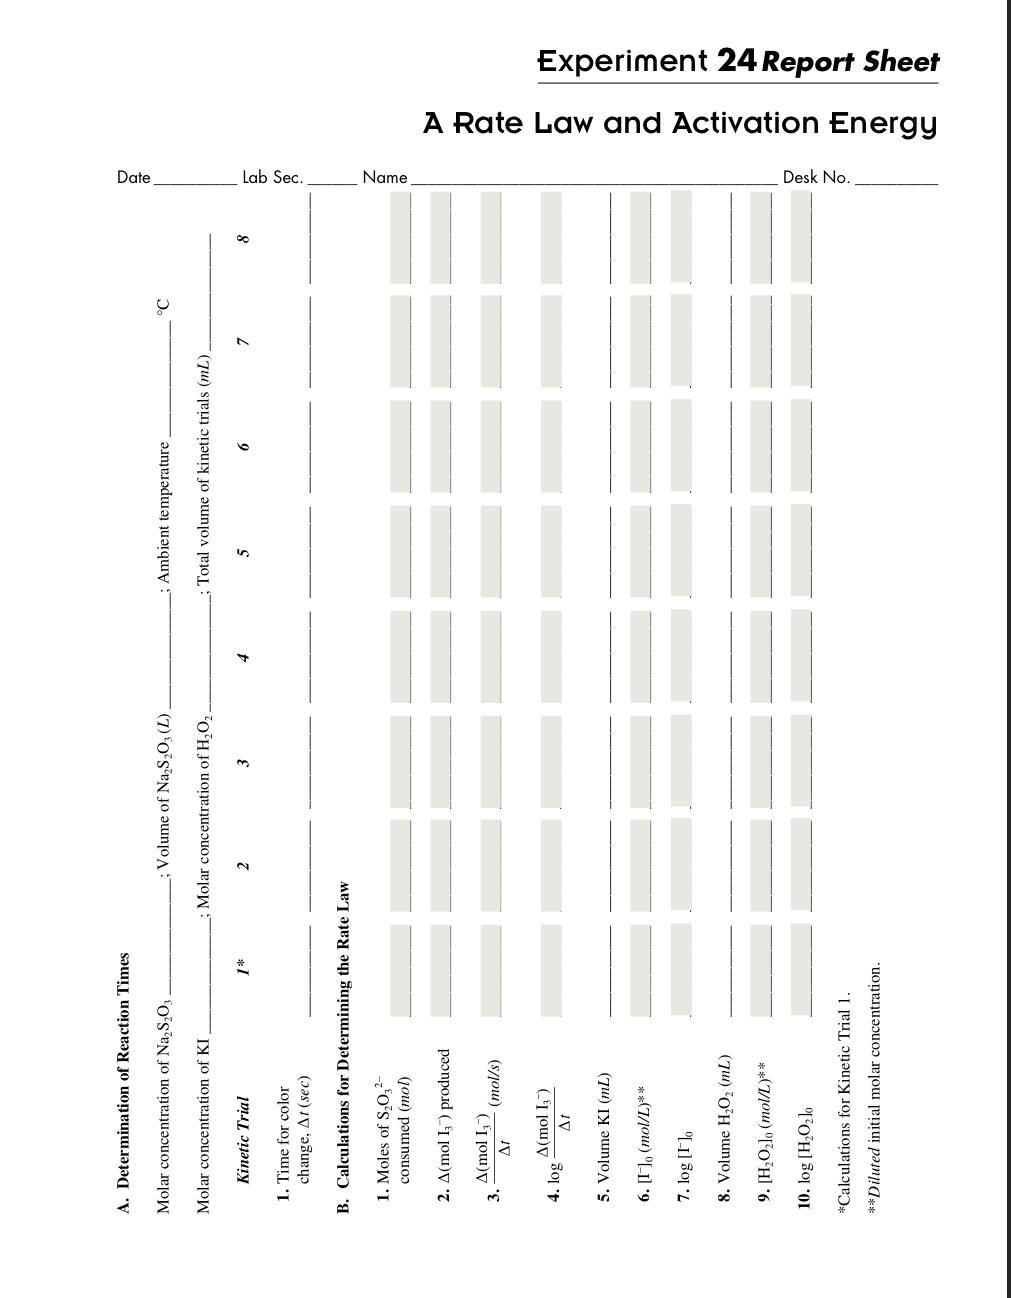
Find everything in the images below. Show work and equations used. Solution A set up: * Trail 9 and 10 have same numbers at trial
Find everything in the images below. Show work and equations used.
Solution A set up:
* Trail 9 and 10 have same numbers at trial 4 except one is placed in hot water and other is placed in cold water
| Kinetic Trial | Boiled DI H2O | Buffer (mL) | 0.3KI (mL) | 0.02M Na2S2O3 (mL) | Starch (drops) | .1M H2O2 (mL) |
| 1 | 4.0 | 1.0 | 1.0 | 1.0 | 5 | 3.0 |
| 2 | 3.0 | 1.0 | 2.0 | 1.0 | 5 | 3.0 |
| 3 | 2.0 | 1.0 | 3.0 | 1.0 | 5 | 3.0 |
| 4 | 1.0 | 1.0 | 4.0 | 1.0 | 5 | 3.0 |
| 5 | 2.0 | 1.0 | 1.0 | 1.0 | 5 | 5.0 |
| 6 | 1.0 | 1.0 | 1.0 | 1.0 | 5 | 7.0 |
| 7 | 2.0 | 1.0 | 1.0 | 1.0 | 5 | 2.0 |
| 8 class design | 4.0 | 1.0 | 2.0 | 1.0 | 5 | 2.0 |
| 9 hot water | 1.0 | 1.0 | 4.0 | 1.0 | 5 | 3.0 |
| 10 cold water | 1.0 | 1.0 | 4.0 | 1.0 | 5 | 3.0 |
Results from mixing solutionA and B:
| Trial | Time (secs) | Temperature (Celsius) |
| 1 | 92 | - |
| 2 | 47 | - |
| 3 | 34 | - |
| 4 | 22 | 22 |
| 5 | 56 | - |
| 6 | 37 | - |
| 7 | 149 | - |
| 8 class design | 73 | - |
| 9 hot water | 16 | 41 |
| 10 cold water | 33 | 11 |


Step by Step Solution
There are 3 Steps involved in it
Step: 1

Get Instant Access to Expert-Tailored Solutions
See step-by-step solutions with expert insights and AI powered tools for academic success
Step: 2

Step: 3

Ace Your Homework with AI
Get the answers you need in no time with our AI-driven, step-by-step assistance
Get Started


