Answered step by step
Verified Expert Solution
Question
1 Approved Answer
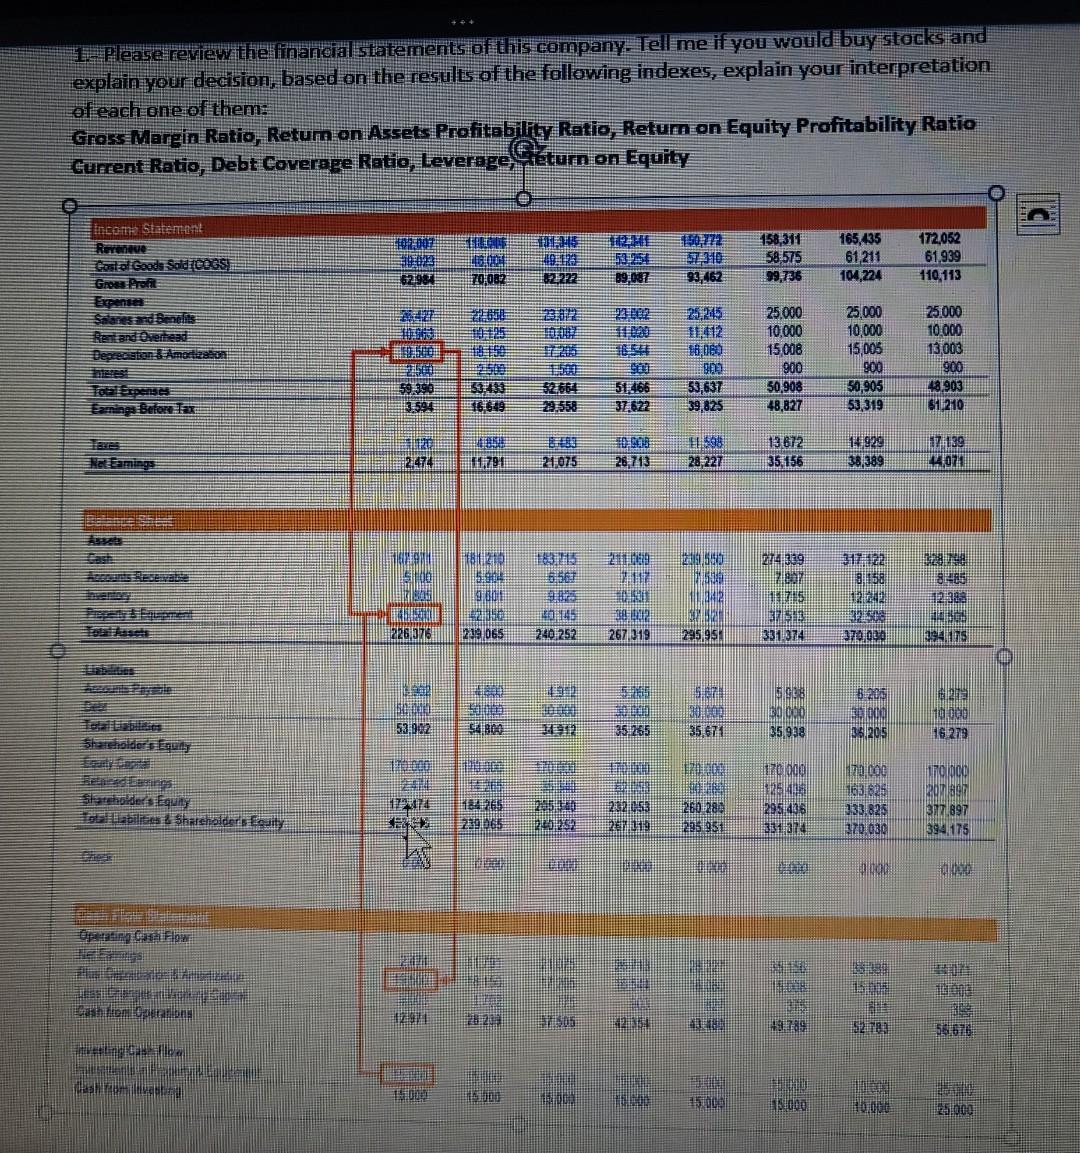
find Gross Margin Ratio,Return on Assets Profitability Ratio, Return on Equity profitability Ratio, Current Ratio , Debt Coverage Ratio, Leverage , Return on Equity from

find Gross Margin Ratio,Return on Assets Profitability Ratio, Return on Equity profitability Ratio, Current Ratio , Debt Coverage Ratio, Leverage , Return on Equity from the following questions in the picture and question is also in the picture answer all the questions in the picture
Please review the financial statements of this company. Tell me if you would buy stocks and explain your decision, based on the results of the following indexes, explain your interpretation of each one of them: Gross Margin Ratio, Retum on Assets Profitability Ratio, Return on Equity Profitability Ratio Current Ratio, Debt Coverage Ratio, Leverage Geturn on Equity 150.172 020072 03 62981 49.123 8172 112 HE 53 254 89,087 158,311 58.575 99,736 165,435 61,211 104,224 172,052 61.939 110,113 70,082 93,462 Income Statement Rareneve costal Goods Sold/Co35) Grosser spense Salanes and Benclits Rent and Overest Depreciation 3 Amortizon 422 2 25,000 25000 23002 1:20 25,245 11012 10.000 25.000 10,000 15008 900 50 908 48,827 10,000 15,005 900 50,905 53 319 13,003 1900 43,903 61.210 obal Supenses Earnings Bateria 59.390 13 594 34 433 116 649 900 53,637 39,825 $2664 29.558 51,466 37.622 R. 2474 3 21075 8208 28 713 1598 28 227 13 672 35 156 14.929 138/389 74139 44,071 1791 274339 802.10 15.04 15 6561 2009 2012 2,50 4500 3421 317122 3158 500 THAN 0001 0 14: 2403257 2 267 019 175 BE 331.374 3285 2398 10 294,175 226,376 219 065 29595 370.000 ten 32 5. 57 30.000 35 673 8206 2.000 35 205 Hoe 53.002 0.000 35.938 35.255 116 279 Shreeholderfuuty 10000 lateholders Equity Labilities & Shareholders folity 21 134 265 239065 23 250282 2020:53 19 260-280 235951 170 000 125 406 295,436 331.374 1970 000 163,625 233.826 270.030 170 000 20780 317 897 394 175 W 000 . AD . 39 15 FILE homopo 2020 2 5576 BER ve 000 100 315.000 3000 120.000 Please review the financial statements of this company. Tell me if you would buy stocks and explain your decision, based on the results of the following indexes, explain your interpretation of each one of them: Gross Margin Ratio, Retum on Assets Profitability Ratio, Return on Equity Profitability Ratio Current Ratio, Debt Coverage Ratio, Leverage Geturn on Equity 150.172 020072 03 62981 49.123 8172 112 HE 53 254 89,087 158,311 58.575 99,736 165,435 61,211 104,224 172,052 61.939 110,113 70,082 93,462 Income Statement Rareneve costal Goods Sold/Co35) Grosser spense Salanes and Benclits Rent and Overest Depreciation 3 Amortizon 422 2 25,000 25000 23002 1:20 25,245 11012 10.000 25.000 10,000 15008 900 50 908 48,827 10,000 15,005 900 50,905 53 319 13,003 1900 43,903 61.210 obal Supenses Earnings Bateria 59.390 13 594 34 433 116 649 900 53,637 39,825 $2664 29.558 51,466 37.622 R. 2474 3 21075 8208 28 713 1598 28 227 13 672 35 156 14.929 138/389 74139 44,071 1791 274339 802.10 15.04 15 6561 2009 2012 2,50 4500 3421 317122 3158 500 THAN 0001 0 14: 2403257 2 267 019 175 BE 331.374 3285 2398 10 294,175 226,376 219 065 29595 370.000 ten 32 5. 57 30.000 35 673 8206 2.000 35 205 Hoe 53.002 0.000 35.938 35.255 116 279 Shreeholderfuuty 10000 lateholders Equity Labilities & Shareholders folity 21 134 265 239065 23 250282 2020:53 19 260-280 235951 170 000 125 406 295,436 331.374 1970 000 163,625 233.826 270.030 170 000 20780 317 897 394 175 W 000 . AD . 39 15 FILE homopo 2020 2 5576 BER ve 000 100 315.000 3000 120.000Step by Step Solution
There are 3 Steps involved in it
Step: 1

Get Instant Access to Expert-Tailored Solutions
See step-by-step solutions with expert insights and AI powered tools for academic success
Step: 2

Step: 3

Ace Your Homework with AI
Get the answers you need in no time with our AI-driven, step-by-step assistance
Get Started


