

Answered step by step
Verified Expert Solution
Question
1 Approved Answer
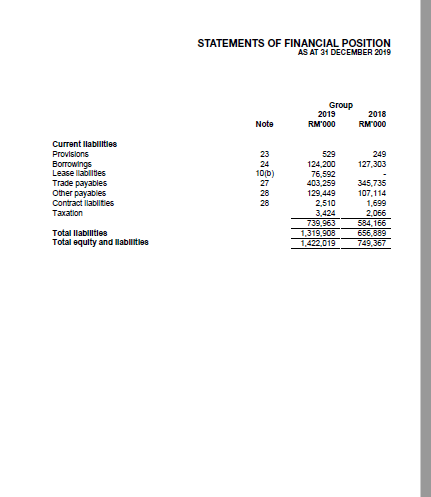
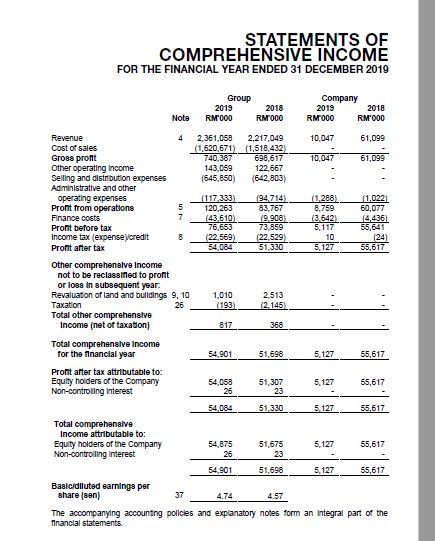
Find Market ratio Dividend Per Share Retain Earning Profitability ratio Return on Equity Return on Asset STATEMENTS OF FINANCIAL POSITION AS AT 31 DECEMBER 2019

Find
Market ratio
Dividend Per Share
Retain Earning
Profitability ratio
Return on Equity
Return on Asset
STATEMENTS OF FINANCIAL POSITION AS AT 31 DECEMBER 2019 Note Group 2019 RM 000 2018 RM7000 338,129 608,530 323,982 Assets Non-current assets Property, plant and equipment Right-of-use assets Investment property Intangible assets Other Investment Sundry receivables 9 10(a) 11 12 14 15 29,390 28.000 14,533 1,018,582 400 34,289 1 33.695 392,367 Current assets Inventories Sundry receivables Cash and bank balances 16 15 17 231,330 75,900 96,207 403,437 1,422,019 224,682 59,770 72.548 357000 749,367 18 19 20 21 22 Total assets Equity and liabilities Equity attributable to equity holders of the Company Share capital Treasury Shares Capital reorganisation deficit Assets revaluation reserve Retained profits Non-controlling Interest Total equity Non-current abilities Provisions Borrowings Lease labilities Contractables Deferred tax labilities 1,485,138 1,485,138 (128,928) (161,941) (1,343,248) (1,343,248) 41.969 41.152 46,985 71.208 101,916 92,309 195 169 102,111 92,478 7.742 44,611 23 24 100) 28 26 9,804 25,200 530,520 4,549 9.872 579,945 1,520 18,850 72.723 STATEMENTS OF FINANCIAL POSITION AS AT 31 DECEMBER 2019 Group 2019 RM'000 Note 2018 RM000 249 127,303 Current liabilities Provisions Borrowings Leasellabilities Trade payables Other payables Contract abilities Taxation 23 24 10/0) 27 28 28 529 124.200 76.592 403,259 129,449 2.510 3,424 739,963 1,319,908 1,422,019 345.735 107,114 1,699 2.066 584 166 656,889 749,367 Total Ilabilities Total equity and liabilities STATEMENTS OF COMPREHENSIVE INCOME FOR THE FINANCIAL YEAR ENDED 31 DECEMBER 2019 Group 2019 2018 RM1000 RM1000 Company 2019 2018 RM000 RM000 Note Revenue 4 2.361,058 2.217.049 10.047 61,099 Cost of sales (1.620,671) (1,518.432) Gross pront 740,387 698.617 10,047 61,099 Other operating Income 143,059 122.667 Selling and distribution expenses (645,850) (642,803) Administrative and other operating expenses (117,333) 194.714) (1,288) (1.022 Profit from operations 5 120.263 83,767 8,759 60,077 Finance costs (43.610 19.908) (3.642) 14,436) Pront before tax 76,653 73.859 5.117 55,641 Income tax expense credit 8 (22,569) (22.529 10 (24) Profit after tax 54,084 51,330 5.127 55,617 Other comprehensive Income not to be reclassified to pront or loss in subsequent year: Revaluaton of land and buildings 9, 10 1,010 2.513 Taxation 26 (193) (2.145) Total other comprehensive Income (net of taxation) 817 368 Total comprehensive Income for the financial year 54,901 51.698 5.127 55,617 Pront after tax attributable to: Equity holders of the Company 54,058 51,307 5,127 55,617 Non-controling interest 26 23 54.084 51,330 5.127 55,617 Total comprehensive Income attributable to: Equity holders of the Company 54,875 51,678 5,127 55,617 Non-controlling interest 26 23 54,901 51,698 5.127 55,617 Baalcidiluted earningo per share (sen) 37 4.57 The accompanying accounting policies and explanatory notes form an Integral part of the financial statements STATEMENTS OF FINANCIAL POSITION AS AT 31 DECEMBER 2019 Note Group 2019 RM 000 2018 RM7000 338,129 608,530 323,982 Assets Non-current assets Property, plant and equipment Right-of-use assets Investment property Intangible assets Other Investment Sundry receivables 9 10(a) 11 12 14 15 29,390 28.000 14,533 1,018,582 400 34,289 1 33.695 392,367 Current assets Inventories Sundry receivables Cash and bank balances 16 15 17 231,330 75,900 96,207 403,437 1,422,019 224,682 59,770 72.548 357000 749,367 18 19 20 21 22 Total assets Equity and liabilities Equity attributable to equity holders of the Company Share capital Treasury Shares Capital reorganisation deficit Assets revaluation reserve Retained profits Non-controlling Interest Total equity Non-current abilities Provisions Borrowings Lease labilities Contractables Deferred tax labilities 1,485,138 1,485,138 (128,928) (161,941) (1,343,248) (1,343,248) 41.969 41.152 46,985 71.208 101,916 92,309 195 169 102,111 92,478 7.742 44,611 23 24 100) 28 26 9,804 25,200 530,520 4,549 9.872 579,945 1,520 18,850 72.723 STATEMENTS OF FINANCIAL POSITION AS AT 31 DECEMBER 2019 Group 2019 RM'000 Note 2018 RM000 249 127,303 Current liabilities Provisions Borrowings Leasellabilities Trade payables Other payables Contract abilities Taxation 23 24 10/0) 27 28 28 529 124.200 76.592 403,259 129,449 2.510 3,424 739,963 1,319,908 1,422,019 345.735 107,114 1,699 2.066 584 166 656,889 749,367 Total Ilabilities Total equity and liabilities STATEMENTS OF COMPREHENSIVE INCOME FOR THE FINANCIAL YEAR ENDED 31 DECEMBER 2019 Group 2019 2018 RM1000 RM1000 Company 2019 2018 RM000 RM000 Note Revenue 4 2.361,058 2.217.049 10.047 61,099 Cost of sales (1.620,671) (1,518.432) Gross pront 740,387 698.617 10,047 61,099 Other operating Income 143,059 122.667 Selling and distribution expenses (645,850) (642,803) Administrative and other operating expenses (117,333) 194.714) (1,288) (1.022 Profit from operations 5 120.263 83,767 8,759 60,077 Finance costs (43.610 19.908) (3.642) 14,436) Pront before tax 76,653 73.859 5.117 55,641 Income tax expense credit 8 (22,569) (22.529 10 (24) Profit after tax 54,084 51,330 5.127 55,617 Other comprehensive Income not to be reclassified to pront or loss in subsequent year: Revaluaton of land and buildings 9, 10 1,010 2.513 Taxation 26 (193) (2.145) Total other comprehensive Income (net of taxation) 817 368 Total comprehensive Income for the financial year 54,901 51.698 5.127 55,617 Pront after tax attributable to: Equity holders of the Company 54,058 51,307 5,127 55,617 Non-controling interest 26 23 54.084 51,330 5.127 55,617 Total comprehensive Income attributable to: Equity holders of the Company 54,875 51,678 5,127 55,617 Non-controlling interest 26 23 54,901 51,698 5.127 55,617 Baalcidiluted earningo per share (sen) 37 4.57 The accompanying accounting policies and explanatory notes form an Integral part of the financial statementsStep by Step Solution
There are 3 Steps involved in it
Step: 1

Get Instant Access to Expert-Tailored Solutions
See step-by-step solutions with expert insights and AI powered tools for academic success
Step: 2

Step: 3
Ace Your Homework with AI
Get the answers you need in no time with our AI-driven, step-by-step assistance
Get Started
The Essential Nonprofit Fundraising Handbook
Authors: Michael A. Sand, Linda Lysakowski
1st Edition
1601630727, 978-1601630728