Answered step by step
Verified Expert Solution
Link Copied!

Question

1 Approved Answer

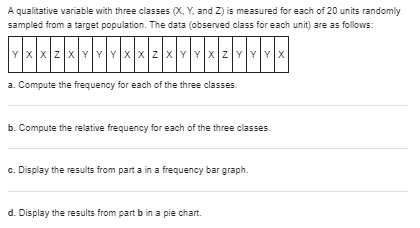
find solutions:- A qualitative variable with three classes (X, Y, and Z) is measured for each of 20 units randomly sampled from a target population.

find solutions:-

image text in transcribedimage text in transcribedimage text in transcribedimage text in transcribedimage text in transcribedimage text in transcribedimage text in transcribedimage text in transcribedimage text in transcribedimage text in transcribedimage text in transcribed
A qualitative variable with three classes (X, Y, and Z) is measured for each of 20 units randomly sampled from a target population. The data (observed class for each unit) are as follows: X XZXY Y Y X X Z X Y Y X Y YX a. Compute the frequency for each of the three classes. b. Compute the relative frequency for each of the three classes. c. Display the results from part a in a frequency bar graph. d. Display the results from part b in a pie chart.Use the applet Standard Deviation to study the effect that an extreme value has on the standard deviation. Begin by setting appropriate limits and plotting the following data on the number line provided in the applet: 06778880910 a. Record the standard deviation. Replace the extreme value of 0 with 2, then 4, and then 6. Record the standard deviation each time. Describe what happens to the standard deviation as 0 is replaced by ever higher numbers. b. How would the standard deviation of the data set compare with the original standard deviation if the 0 were replaced by 16? Explain.Use the applet Standard Deviation to determine whether an item in a data set may be an outlier. Begin by setting appropriate limits and plotting the given data on the number line provided in the applet. Here is the data set: 10 80 80 85 85 85 85 90 90 90 90 90 95 95 95 95 100 100 3. The green arrow shows the approximate location of the mean. Multiply the standard deviation given by the applet by 3. Is the data item 10 more than three standard deviations away from the green arrow (the mean)? Can you conclude that the 10 is an outlier? b. Using the mean and standard deviation from part a, move the point at 10 on your plot to a point that appears to be about three standard deviations from the mean. Repeat the process in part a for the new plot and the new suspected outlier. c. When you replaced the extreme value in part a with a number that appeared to be within three standard deviations of the mean, the standard deviation got smaller and the mean moved to the right, yielding a new data set whose extreme value was not within three standard deviations of the mean. Continue to replace the extreme value with higher numbers until the new value is within three standard deviations of the mean in the new data set. Use trial and error to estimate the smallest number that can replace the 10 in the original data set so that the replacement is not considered to be an outlier.Do social robots walk or roll? According to the United Nations, social robots now outnumber industrial robots worldwide. A social (or service) robot is designed to entertain, educate, and care for human users. In a paper published by the International Conference on Social Robotics (Vol. 8414, 2010). design engineers investigated the trend in the design of social robots. Using a random sample of 106 social robots obtained through a Web search, the engineers found that 63 were built with legs only. 20 with wheels only, 8 with both legs and wheels, and 15 with neither legs nor wheels. This information is portrayed in the accompanying graphic. 3. What type of graph is used to describe the data? b. Identify the variable measured for each of the 108 robot designs. c. Use the graph to identify the social robot design that is currently used the most. d. Compute class relative frequencies for the different categories shown in the graph. e. Use the results from part d to construct a Pareto diagram for the data. 70 40 Both Love Only Wheel Only Type of Helvetic LinksPaying for music downloads. If you use the Internet, have you ever paid to access or download music? This was one of the questions of interest in a recent Pew Internet & American Life Project Survey (October 2010). Telephone interviews were conducted on a representative sample of 1,003 adults living in the United States. For this sample, 248 adults stated that they do not use the Internet, 249 revealed that they use the Internet but have never paid to download music, and the remainder (506 adults) stated that they use the Internet and have paid to download music. The results are summarized in the MINITAB pie chart shown. a. According to the pie chart, what proportion of the sample use the Internet and pay to download music? Verify the accuracy of this proportion using the survey results. b. Now consider only the 755 adults in the sample that use the Internet. Create a graph that compares the proportion of these adults that pay to download music with the proportion that do not pay- Ple Chart of Download-Music Na Internet In barrel . No Pay internet - PaidEstimating the rhino population. The International Rhino Foundation estimates that there are 28,933 rhinoceroses living in the wild in Africa and Asia. A breakdown of the number of rhinos of each species is reported in the accompanying table: Rhino Species Population Estimate African Black African White 20.405 (Asian) Sumatran 100 [ Asian) Javan 40 (Asian) Greater One-Horned 3.313 Total 28,933 Source International Rhine Foundation, 7014. a. Construct a relative frequency table for the data. b. Display the relative frequencies in a bar graph. c. What proportion of the 28,933 rhinos are African rhinos? Asian?STEM experiences for girls. The National Science Foundation (NSF) sponsored a study on girls" participation in informal science, technology. engineering, and mathematics (STEM) programs (see Exercise 1.13). The results of the study were published in Cascading Influences: Long- Term Impacts of Informal STEM Experiences for Girls (Mar. 2013). The researchers questioned 174 young women who recently participated in a STEM program. They used a pie chart to describe the geographic location (urban, suburban, or rural) of the STEM programs attended. Of the 174 STEM participants, 107 were in urban areas, 57 in suburban areas, and 10 in rural areas. Use this information to construct the pie chart. Interpret the results. (Reference Exercise 1.13) STEM experiences for girls. The National Science Foundation (NSF) promotes girls' participation in informal science, technology. engineering. and mathematics (STEM) programs. What has been the impact of these informal STEM experiences? This was the question of interest in the published study Cascading Influences: Long-Term Impacts of Informal STEM Experiences for Girls (Mar. 2013). A sample of 159 young women who recently participated in a STEM program were recruited to complete an online survey. Of these, only 27% felt that participation in the STEM program increased their interest in science. a. Identify the population of interest to the researchers. b. Identify the sample. c. Use the information in the study to make an inference about the relevant population.Genealogy research. The Journal of Family History (Jan. 2010) investigated the genealogy of a certain Korean clan. Of interest was whether or not a family name continued into the next generation in the clan genealogy (called a continued line) or dropped out (called a dropout line). Side by- side pie charts were used to describe the rate at which certain occupational titles of clan individuals occurred within each line type. Similarly constructed MINITAB bar charts are shown on p. 39. a. Identify the two qualitative variables graphed in the side-by-side pie charts. b. Give a full interpretation of the charts. Identify the major differences (if any) between the two line groups. MINITAB Output for Exercise 2.14 CLAN TITLE\f\f\f

Step by Step Solution

There are 3 Steps involved in it

Step: 1

blur-text-image

Get Instant Access to Expert-Tailored Solutions

See step-by-step solutions with expert insights and AI powered tools for academic success

Step: 2

blur-text-image

Step: 3

blur-text-image

Ace Your Homework with AI

Get the answers you need in no time with our AI-driven, step-by-step assistance

Get Started

Recommended Textbook for

Calculus An Applied Approach

Authors: Ron Larson, Dennis J McKenzie, Larson/Edwards, Bruce H Edwards

7th Edition

ISBN: 1111809720, 9781111809720

More Books

Students also viewed these Mathematics questions

Question

What lessons in intervention design, does this case represent?

Answered: 1 week ago