Answered step by step
Verified Expert Solution
Question
1 Approved Answer
Find the Anova and Post Hoc Test 88% 11 Metro by T-Mobile LTE 2:48 PM Michiah stroop data 2021 spreadsheet In the Stroop Sp 2021
Find the Anova and Post Hoc Test 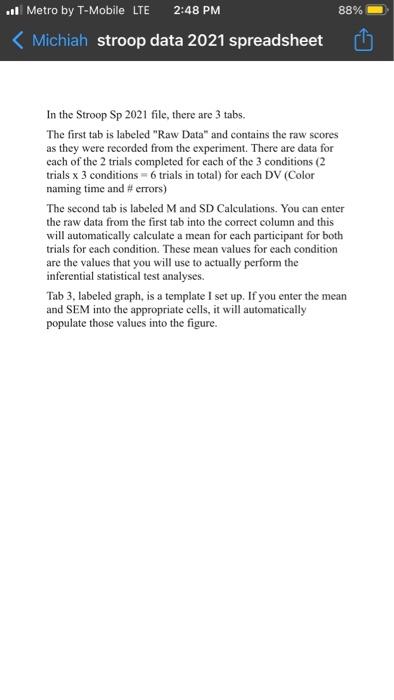
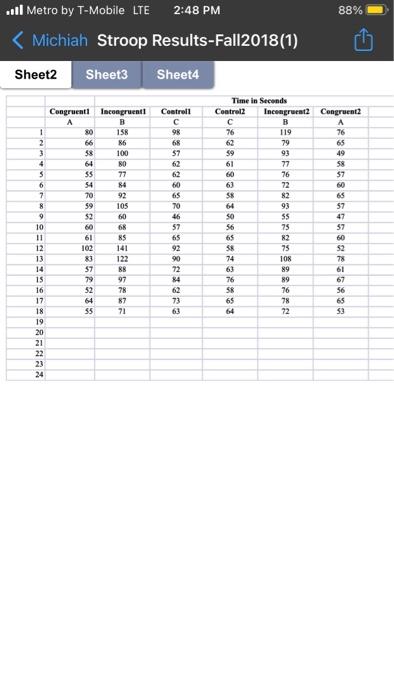
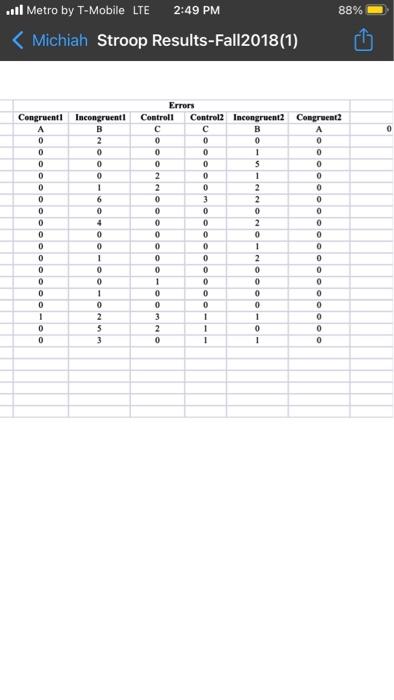
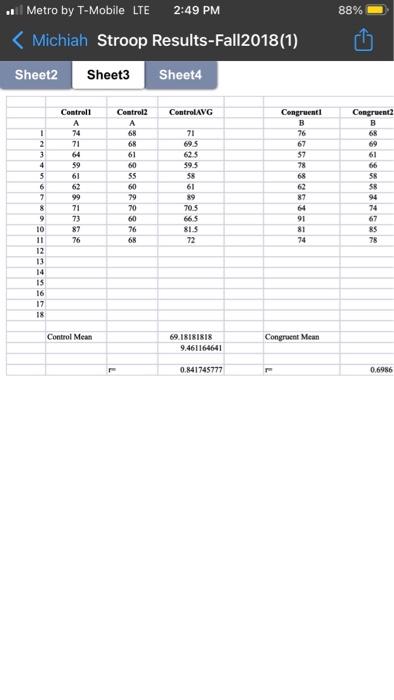
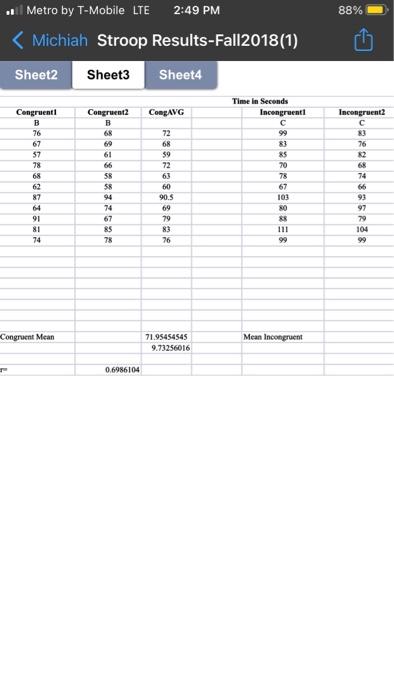
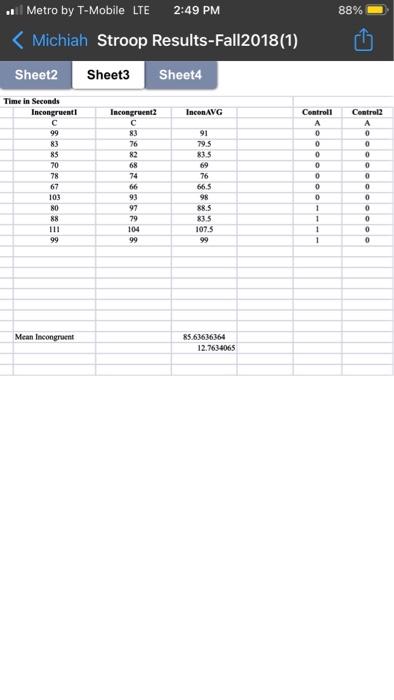
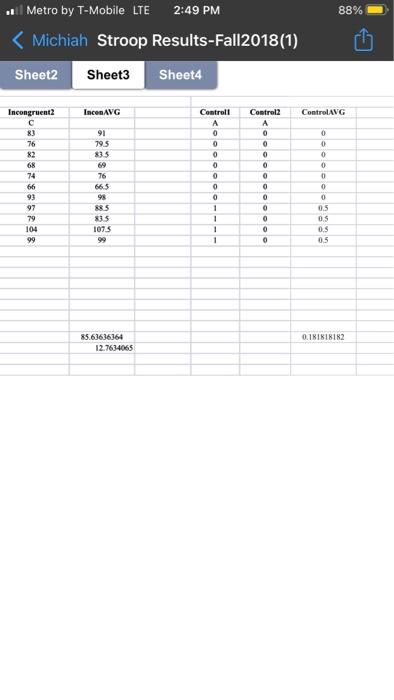
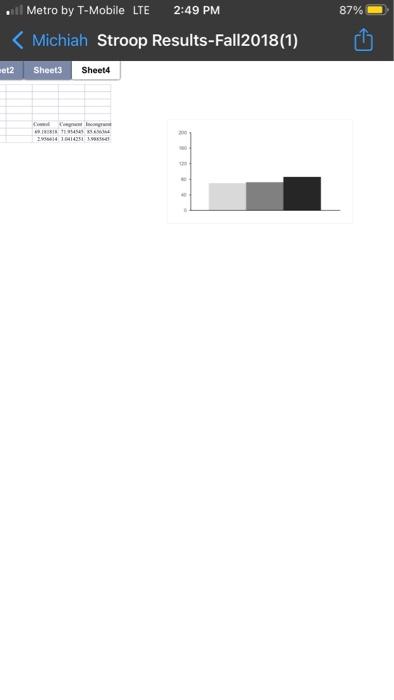
88% 11 Metro by T-Mobile LTE 2:48 PM Michiah stroop data 2021 spreadsheet In the Stroop Sp 2021 file, there are 3 tabs. The first tab is labeled "Raw Data" and contains the raw scores as they were recorded from the experiment. There are data for cach of the 2 trials completed for each of the 3 conditions (2 trials x 3 conditions 6 trials in total) for each DV (Color naming time and # errors) The second tab is labeled M and SD Calculations. You can enter the raw data from the first tab into the correct column and this will automatically calculate a mean for each participant for both trials for each condition. These mean values for each condition are the values that you will use to actually perform the inferential statistical test analyses. Tab 3 labeled graph, is a template I set up. If you enter the mean and SEM into the appropriate cells, it will automatically populate those values into the figure. 2:48 PM 88% ..ll Metro by T-Mobile LTE Michiah Stroop Results-Fall2018(1) Sheet2 Sheet3 Sheet4 158 Controll C 98 68 57 62 Congruent! Incongruenti A B 80 66 86 58 100 64 80 55 77 54 84 70 92 59 105 52 60 60 68 61 RS 102 141 83 122 57 88 79 97 52 78 64 87 55 71 1 2 3 4 5 6 7 8 9 10 11 12 13 14 15 16 17 18 19 20 21 22 23 24 }*********** Time in Seconds Controla Incongruent2 congruent2 B A 76 119 76 79 65 59 93 49 61 77 58 60 76 57 63 72 $$ 82 65 64 93 57 SO SS 47 56 75 57 65 R2 60 SA 75 52 74 108 78 63 89 61 76 89 67 58 76 56 69 78 65 64 22 53 65 70 46 57 65 92 90 72 84 73 2:49 PM 88% ..ll Metro by T-Mobile LTE Michiah Stroop Results-Fall2018(1) 0 Congruenti A 0 0 0 0 Incongruenti B 2 0 0 0 1 Congruent2 0 0 0 0 0 0 0 0 6 0 0 Errors Controll Control2 Incongruent2 B 0 0 0 0 0 1 0 0 5 2 0 1 2 0 2 0 3 2 0 0 0 0 0 2 0 0 0 0 0 1 0 0 2 0 0 0 1 0 0 0 0 0 0 0 0 3 1 1 2 1 0 0 ! 1 0 0 4 0 0 1 0 0 0 0 0 0 0 0 0 0 0 0 0 1 0 1 2 5 3 OOOOO 0 0 88% Metro by T-Mobile LTE 2:49 PM Michiah Stroop Results-Fall2018(1) Sheet2 Sheet3 Sheet4 ControlVG T 1 2 3 4 5 6 7 8 9 10 Controll A 74 71 64 59 61 62 99 71 73 87 76 Control 68 68 61 60 55 60 79 70 60 76 68 71 695 62.5 59.5 58 61 89 Congruenti B 76 67 57 78 68 62 87 64 91 81 74 Congruent2 B 68 69 61 66 58 S8 94 74 67 85 38 705 aassa 665 81.5 72 12 13 14 15 16 17 18 Control Mean Congruent Mean 69.18181818 9.461164641 0.841745777 0.6986 88% Metro by T-Mobile LTE 2:49 PM Michiah Stroop Results-Fall2018(1) Sheet2 Sheet3 Sheet4 CongAVG Time In Seconds Incongruenti Incongruent2 C Congruent2 B 68 69 61 66 76 Congruenti B 76 67 57 78 68 62 87 64 91 81 74 83 85 70 78 67 103 80 *2752 72 68 $9 72 63 60 90.5 69 79 83 76 $8 94 74 67 RS 78 68 74 66 93 97 79 104 99 111 99 Congruent Mean Mean Incongruent 71.95454545 9.73256016 0.6986104 88% Metro by T-Mobile LTE 2:49 PM Michiah Stroop Results-Fall2018(1) Sheet2 Sheet3 Sheets Incongruent2 Incon AVG Controll A 0 0 0 Control A 0 Time in Seconds Incongruent! 99 83 85 70 78 67 103 80 88 111 99 0 0 0 0 O C 83 76 82 68 74 66 93 97 79 104 99 91 79.5 83.5 69 76 66.5 98 88.5 835 107.5 99 0 O 0 0 0 1 1 1 1 0 O 0 O Mean Incongruent R5 61616164 12.763-4065 88% Metro by T-Mobile LTE 2:49 PM Michiah Stroop Results-Fall2018(1) Sheet2 Sheet3 Sheet4 IncenAVG ControlVG Control A O 0 91 Controll A 0 0 0 0 0 795 835 Incongruenta C 83 76 82 68 74 66 93 97 79 104 99 0 0 0 0 0 0 76 665 98 885 835 1075 99 0 0 0 0 0 0 0 O 0 0 O 0 1 1 1 1 0.5 OS 0.5 85.63636364 12.7634065 0.181818182 88% 11 Metro by T-Mobile LTE 2:48 PM Michiah stroop data 2021 spreadsheet In the Stroop Sp 2021 file, there are 3 tabs. The first tab is labeled "Raw Data" and contains the raw scores as they were recorded from the experiment. There are data for cach of the 2 trials completed for each of the 3 conditions (2 trials x 3 conditions 6 trials in total) for each DV (Color naming time and # errors) The second tab is labeled M and SD Calculations. You can enter the raw data from the first tab into the correct column and this will automatically calculate a mean for each participant for both trials for each condition. These mean values for each condition are the values that you will use to actually perform the inferential statistical test analyses. Tab 3 labeled graph, is a template I set up. If you enter the mean and SEM into the appropriate cells, it will automatically populate those values into the figure. 2:48 PM 88% ..ll Metro by T-Mobile LTE Michiah Stroop Results-Fall2018(1) Sheet2 Sheet3 Sheet4 158 Controll C 98 68 57 62 Congruent! Incongruenti A B 80 66 86 58 100 64 80 55 77 54 84 70 92 59 105 52 60 60 68 61 RS 102 141 83 122 57 88 79 97 52 78 64 87 55 71 1 2 3 4 5 6 7 8 9 10 11 12 13 14 15 16 17 18 19 20 21 22 23 24 }*********** Time in Seconds Controla Incongruent2 congruent2 B A 76 119 76 79 65 59 93 49 61 77 58 60 76 57 63 72 $$ 82 65 64 93 57 SO SS 47 56 75 57 65 R2 60 SA 75 52 74 108 78 63 89 61 76 89 67 58 76 56 69 78 65 64 22 53 65 70 46 57 65 92 90 72 84 73 2:49 PM 88% ..ll Metro by T-Mobile LTE Michiah Stroop Results-Fall2018(1) 0 Congruenti A 0 0 0 0 Incongruenti B 2 0 0 0 1 Congruent2 0 0 0 0 0 0 0 0 6 0 0 Errors Controll Control2 Incongruent2 B 0 0 0 0 0 1 0 0 5 2 0 1 2 0 2 0 3 2 0 0 0 0 0 2 0 0 0 0 0 1 0 0 2 0 0 0 1 0 0 0 0 0 0 0 0 3 1 1 2 1 0 0 ! 1 0 0 4 0 0 1 0 0 0 0 0 0 0 0 0 0 0 0 0 1 0 1 2 5 3 OOOOO 0 0 88% Metro by T-Mobile LTE 2:49 PM Michiah Stroop Results-Fall2018(1) Sheet2 Sheet3 Sheet4 ControlVG T 1 2 3 4 5 6 7 8 9 10 Controll A 74 71 64 59 61 62 99 71 73 87 76 Control 68 68 61 60 55 60 79 70 60 76 68 71 695 62.5 59.5 58 61 89 Congruenti B 76 67 57 78 68 62 87 64 91 81 74 Congruent2 B 68 69 61 66 58 S8 94 74 67 85 38 705 aassa 665 81.5 72 12 13 14 15 16 17 18 Control Mean Congruent Mean 69.18181818 9.461164641 0.841745777 0.6986 88% Metro by T-Mobile LTE 2:49 PM Michiah Stroop Results-Fall2018(1) Sheet2 Sheet3 Sheet4 CongAVG Time In Seconds Incongruenti Incongruent2 C Congruent2 B 68 69 61 66 76 Congruenti B 76 67 57 78 68 62 87 64 91 81 74 83 85 70 78 67 103 80 *2752 72 68 $9 72 63 60 90.5 69 79 83 76 $8 94 74 67 RS 78 68 74 66 93 97 79 104 99 111 99 Congruent Mean Mean Incongruent 71.95454545 9.73256016 0.6986104 88% Metro by T-Mobile LTE 2:49 PM Michiah Stroop Results-Fall2018(1) Sheet2 Sheet3 Sheets Incongruent2 Incon AVG Controll A 0 0 0 Control A 0 Time in Seconds Incongruent! 99 83 85 70 78 67 103 80 88 111 99 0 0 0 0 O C 83 76 82 68 74 66 93 97 79 104 99 91 79.5 83.5 69 76 66.5 98 88.5 835 107.5 99 0 O 0 0 0 1 1 1 1 0 O 0 O Mean Incongruent R5 61616164 12.763-4065 88% Metro by T-Mobile LTE 2:49 PM Michiah Stroop Results-Fall2018(1) Sheet2 Sheet3 Sheet4 IncenAVG ControlVG Control A O 0 91 Controll A 0 0 0 0 0 795 835 Incongruenta C 83 76 82 68 74 66 93 97 79 104 99 0 0 0 0 0 0 76 665 98 885 835 1075 99 0 0 0 0 0 0 0 O 0 0 O 0 1 1 1 1 0.5 OS 0.5 85.63636364 12.7634065 0.181818182 


Step by Step Solution
There are 3 Steps involved in it
Step: 1

Get Instant Access to Expert-Tailored Solutions
See step-by-step solutions with expert insights and AI powered tools for academic success
Step: 2

Step: 3

Ace Your Homework with AI
Get the answers you need in no time with our AI-driven, step-by-step assistance
Get Started


