Question
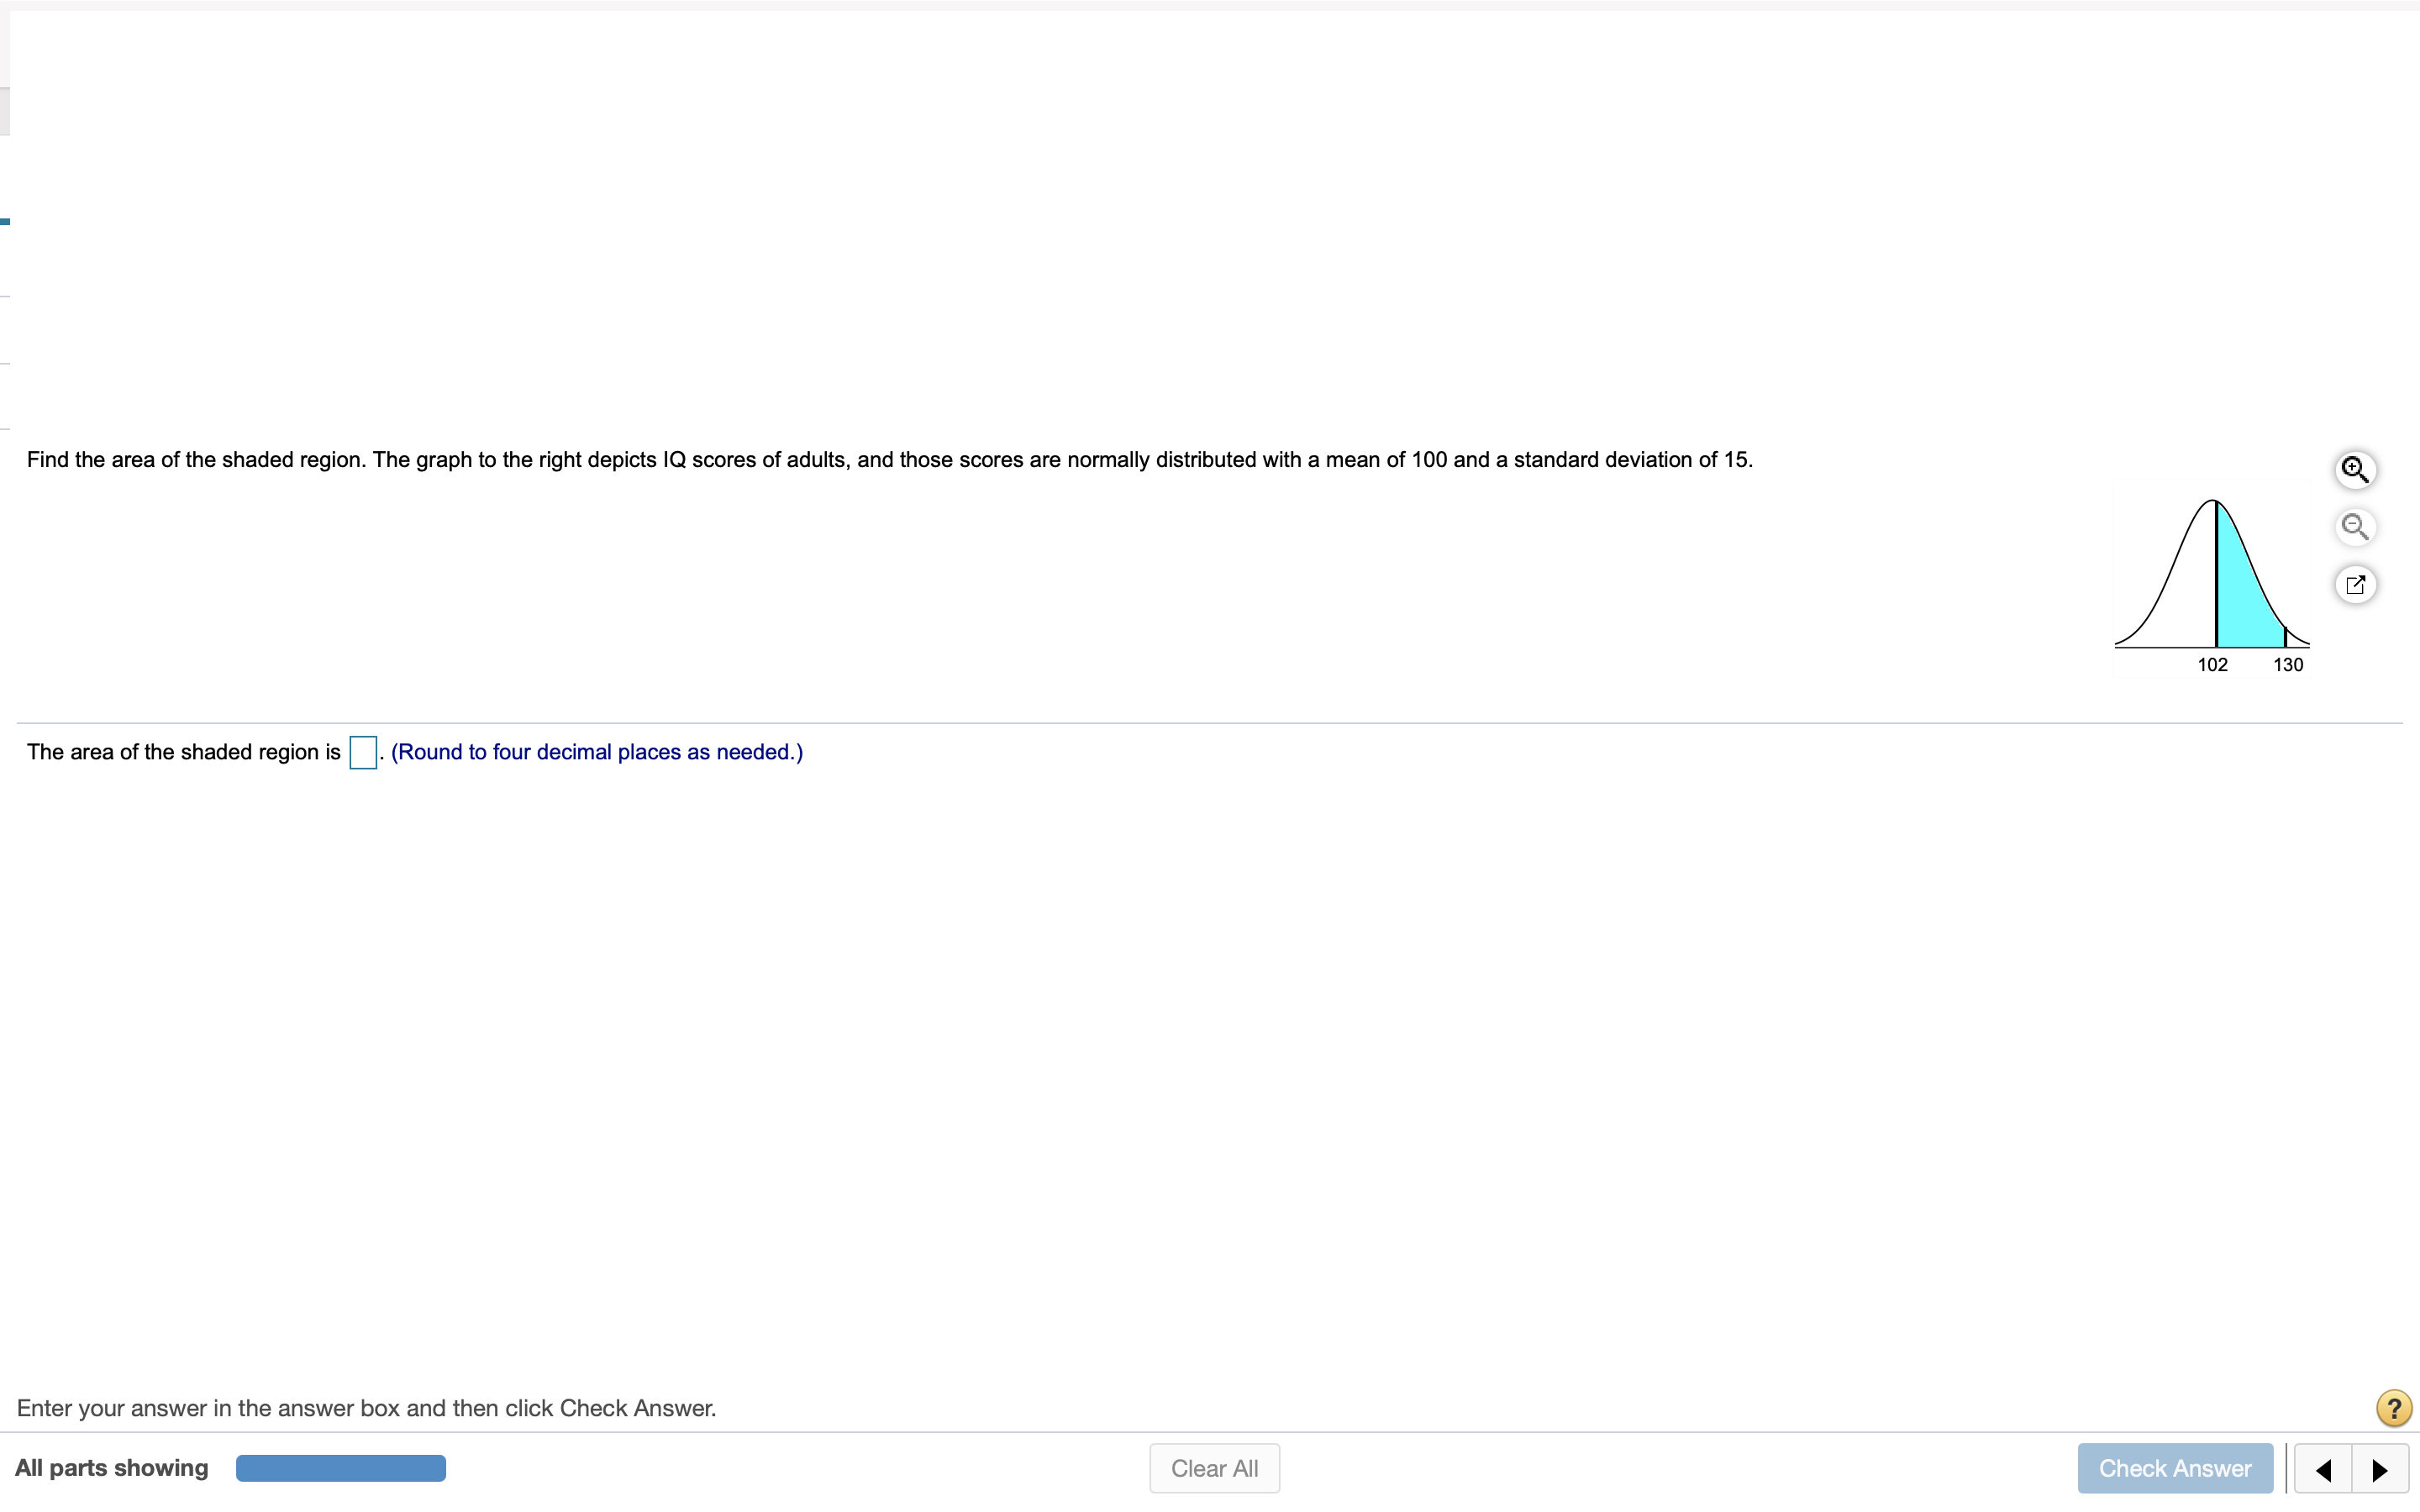
Find the area of the shaded region. The graph to the right depicts IQ scores of?adults, and those scores are normally distributed with a mean
Find the area of the shaded region. The graph to the right depicts IQ scores of?adults, and those scores are normally distributed with a mean of 100 and a standard deviation of 15.
102
130
A symmetric bell-shaped curve is plotted over a horizontal scale. Two vertical lines run from the scale to the curve at labeled coordinates 102 and 130, which are both to the right of the curve's center and peak. The area under the curve between the vertical lines is shaded.
The area of the shaded region is
nothing
. ?(Round to four decimal places as?needed.)

Step by Step Solution
There are 3 Steps involved in it
Step: 1

Get Instant Access to Expert-Tailored Solutions
See step-by-step solutions with expert insights and AI powered tools for academic success
Step: 2

Step: 3

Ace Your Homework with AI
Get the answers you need in no time with our AI-driven, step-by-step assistance
Get Started


