

Question
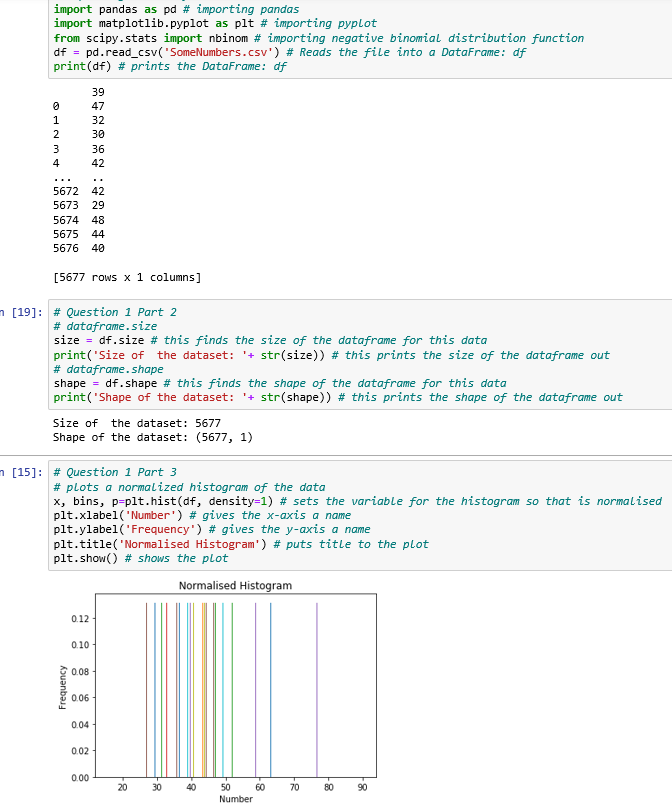
Find the best-fit distribution using Maximum Likelihood Estimation (MLE). Describe the data: state the size and shape of the dataset and the nature of the
Find the best-fit distribution using Maximum Likelihood Estimation (MLE).
Describe the data: state the size and shape of the dataset and the nature of the numbers enclosed.
Plot a normalised histogram of the data.
These data come from a Negative Binomial distribution. Write a function to compute the log-likelihood. You can let log(0) = 0 if required.
The Negative Binomial distribution has two parameters, N and p. Using your code from part 4, compute the values of log-likelihood for values of N in the range [10-60] and p in the range [0-1] (e.g. use 50 values). Plot your results as a two-dimensional plot with the value of log-likelihood as the colour (or equivalently, make a contour or three dimensional plot). Ensure you comment on the results.
Compute the maximum of the log-likelihood and find the best-fit values of N and p. Make a plot of the best-fit distribution on top of the histogram from part 3. Comment on your results.
What does it mean by the nature of the numbers enclosed and how do you find it. And can you please help with the rest of the question please
Step by Step Solution
There are 3 Steps involved in it
Step: 1

Get Instant Access to Expert-Tailored Solutions
See step-by-step solutions with expert insights and AI powered tools for academic success
Step: 2

Step: 3
Ace Your Homework with AI
Get the answers you need in no time with our AI-driven, step-by-step assistance
Get Started
Modern Dental Assisting
Authors: Doni Bird, Debbie Robinson
13th Edition
978-0323624855, 0323624855