

Answered step by step
Verified Expert Solution
Question
1 Approved Answer
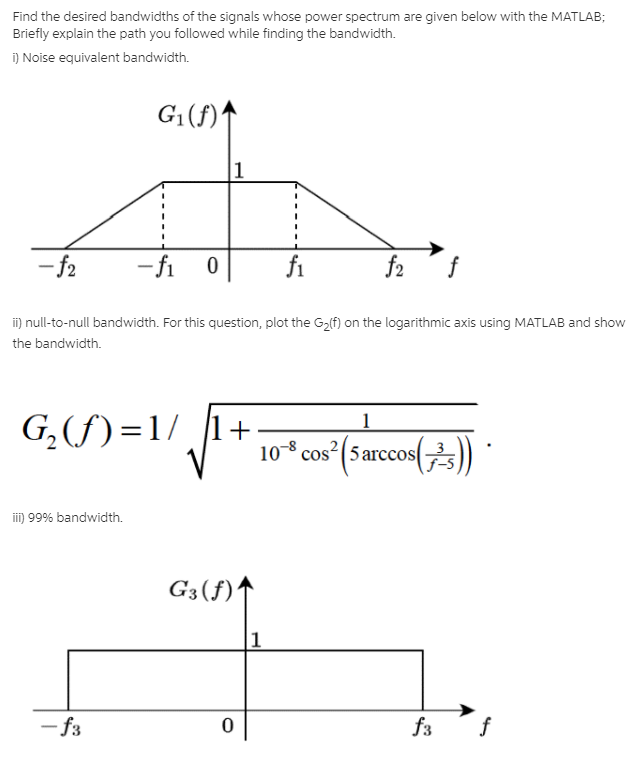
Find the desired bandwidths of the signals whose power spectrum are given below with the MATLAB; Briefly explain the path you followed while finding the
Step by Step Solution
There are 3 Steps involved in it
Step: 1

Get Instant Access to Expert-Tailored Solutions
See step-by-step solutions with expert insights and AI powered tools for academic success
Step: 2

Step: 3
Ace Your Homework with AI
Get the answers you need in no time with our AI-driven, step-by-step assistance
Get Started
Optimizing Database Performance Techniques To Optimize The Efficiency Of Database Systems And Applications
Authors: Craig S Mullins
1st Edition
B0CFZFD49Y, 979-8857641286