

Answered step by step
Verified Expert Solution
Question
1 Approved Answer
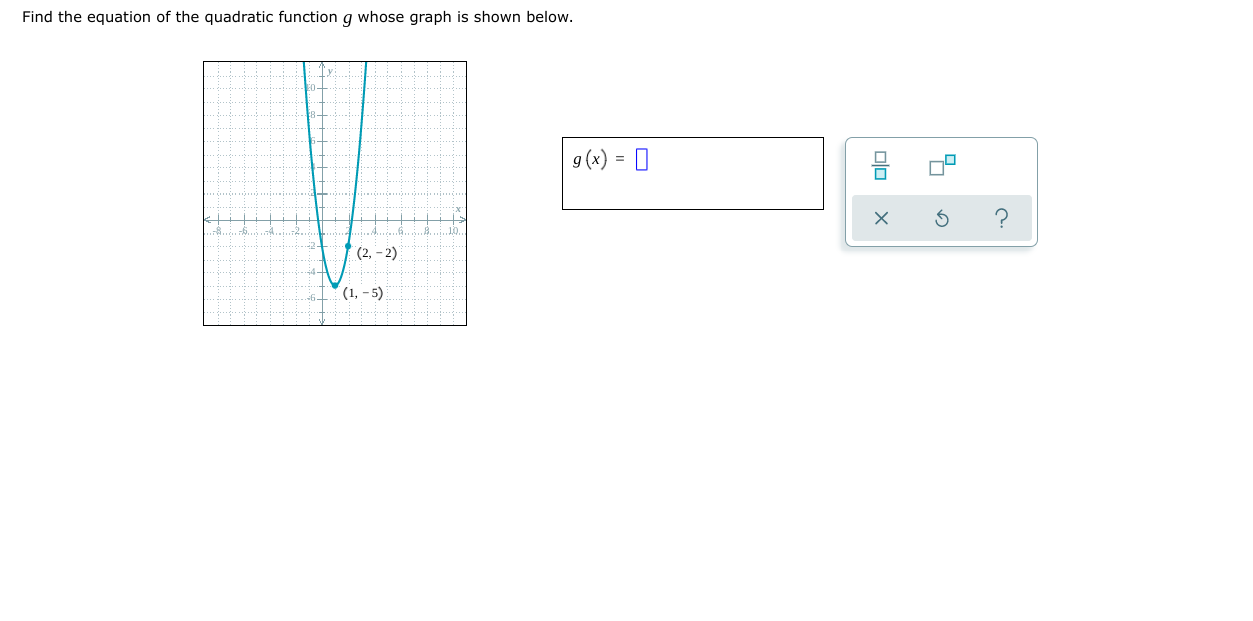
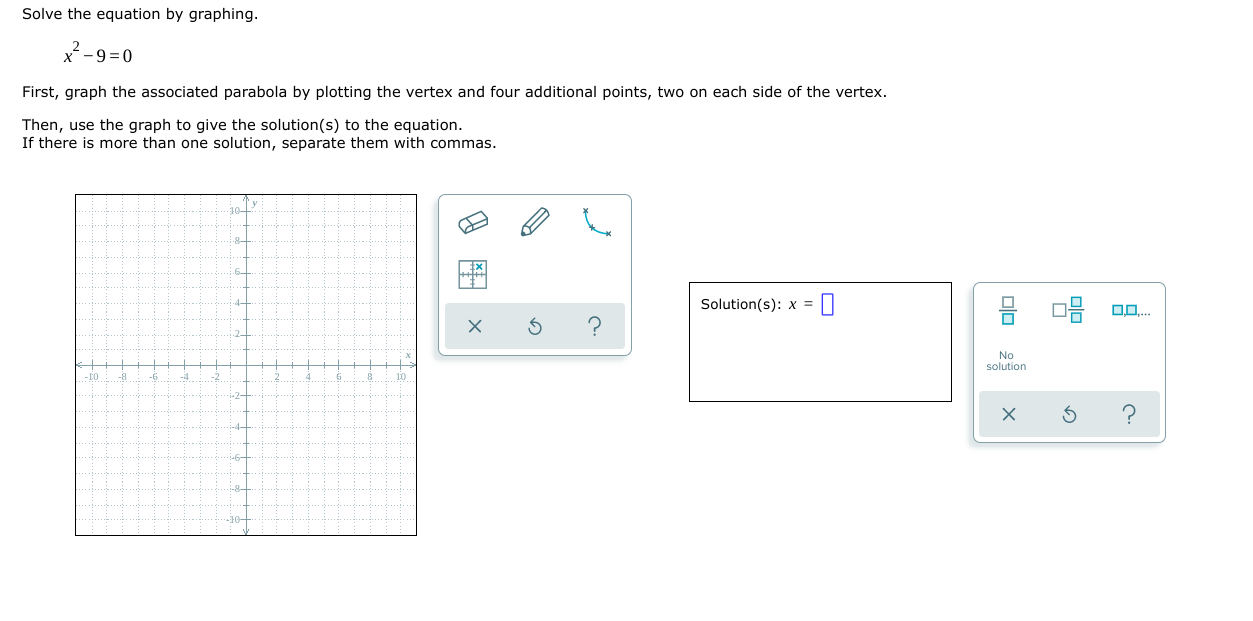
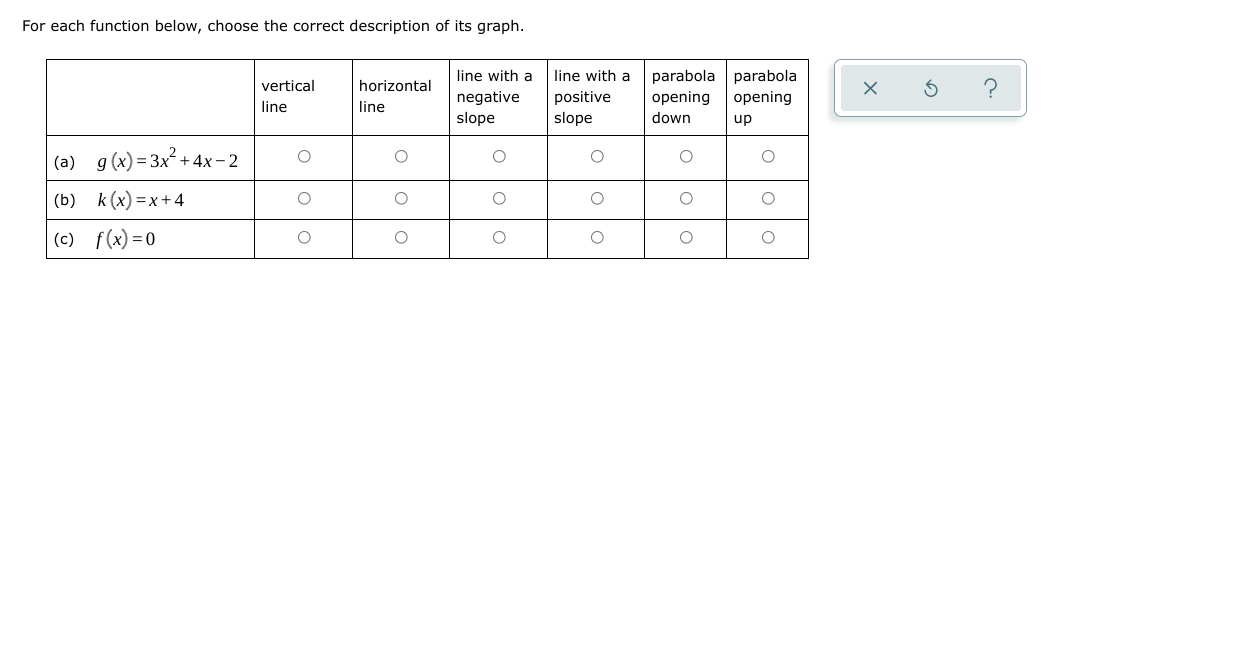
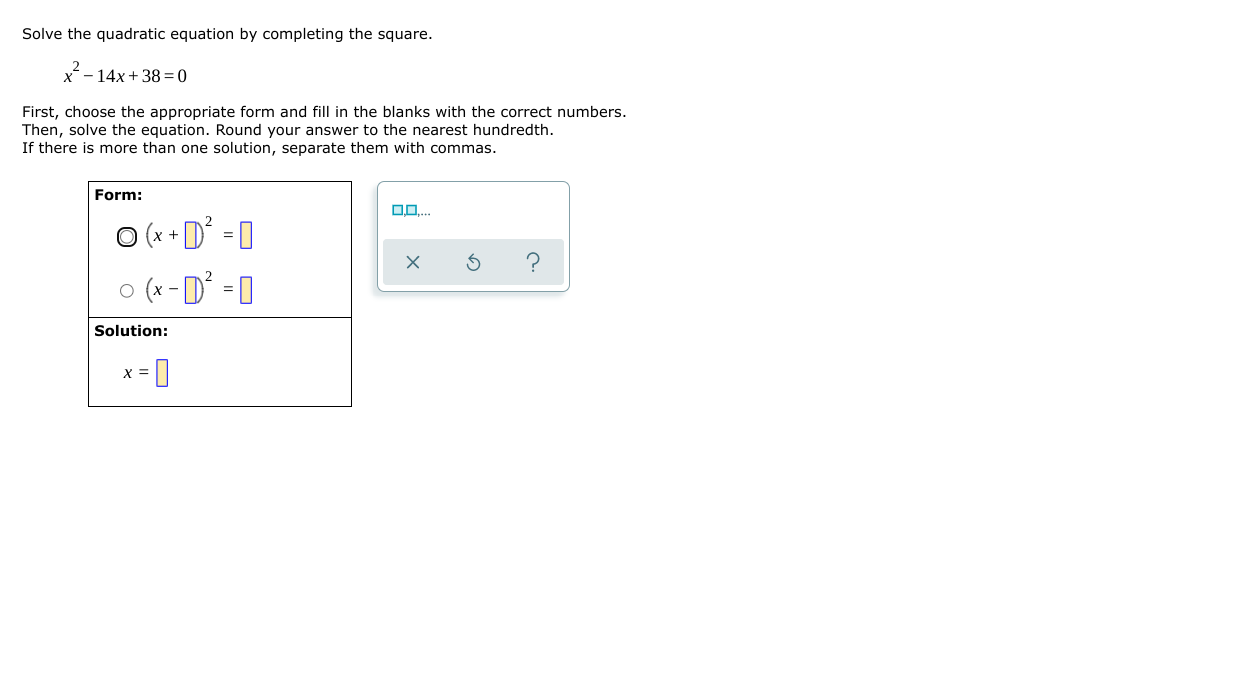
Find the equation of the quadratic function g whose graph is shown below. Solve the equation by graphing. 2 x 9 = 0 First, graph
Step by Step Solution
There are 3 Steps involved in it
Step: 1

Get Instant Access to Expert-Tailored Solutions
See step-by-step solutions with expert insights and AI powered tools for academic success
Step: 2

Step: 3
Ace Your Homework with AI
Get the answers you need in no time with our AI-driven, step-by-step assistance
Get Started
Pre Algebra Workbook 6th Grade Order Of Operations
Authors: Baby Professor
1st Edition
1682800490, 978-1682800492