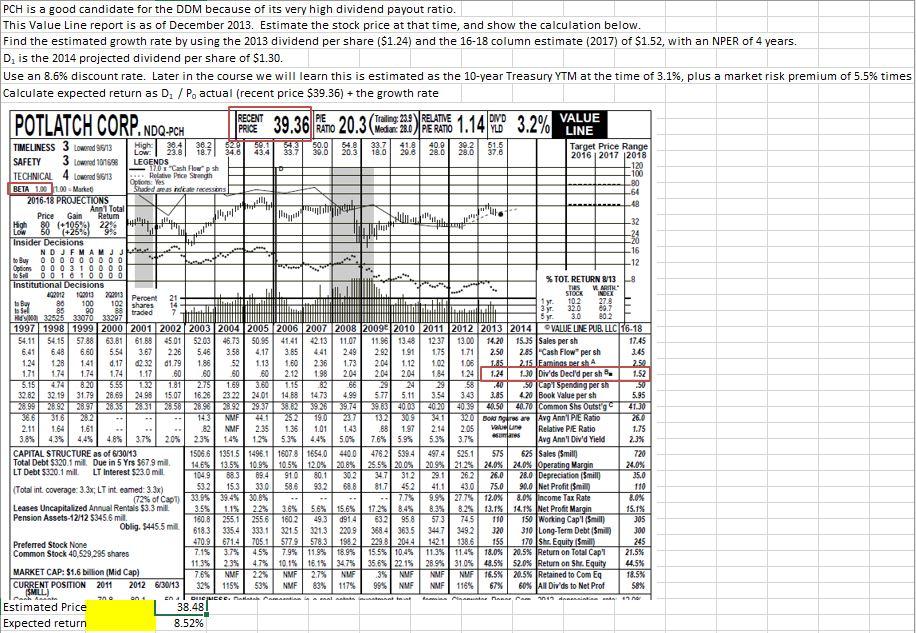
Find the estimated growth rate by using the 2013 dividend per share ($1.24) and the 16-18 column estimate (2017) of $1.52, with an NPER of 4 years.
20.3 ( 1.14 ta IM www 102 shares PCH is a good candidate for the DDM because of its very high dividend payout ratio. This Value Line report is as of December 2013. Estimate the stock price at that time, and show the calculation below. Find the estimated growth rate by using the 2013 dividend per share ($1.24) and the 16-18 column estimate (2017) of $1.52, with an NPER of 4 years. Dis the 2014 projected dividend per share of $1.30. Use an 8.6% discount rate. Later in the course we will learn this is estimated as the 10-year Treasury YTM at the time of 3.1%, plus a market risk premium of 5.5% times Calculate expected return as D. / P. actual (recent price $39.36) + the growth rate POTLATCH CORP. NDO.PCH RECENT PE VALUE PRICE 39.36 RATIO Media 28.0 / PE RATIO YLD 3.2% LINE TIMELINESS 3 Lowered 96/13 High 50.1 50.0 33.7 41.8 409 43.4 Target Price Range SAFETY 3 Lowred 100159 LEGENDS 2016 2017 2018 1201 Cash Flowpsh 120 TECHNICAL 4 Lowered 96/13 Relative Price Strength 100 Optio: Yes BETA 1.001.00 - Market Shaded and recessors .80 2016-18 PROJECTIONS -64 Ann Total Price Gain Retum High 88 1989 228 M -32 Low (+25) 9 Insider Decisions -20 NDJEMAMJJ -16 to Buy OOOOOOOO Options 0 0 0 1 0 0 0 0 -12 to 50 00 i Institutional Decisions % TOT. RETURN 8/13 -8 422012 100003 202013 Thes VE ARITH 21 STOCK Percent INDEX to Buy 88 100 14 102 y. 278 to Sol 00 85 88 traded 7 320 3 yr 32525 33070 33207 89.7 syr 3.0 802 1997 1998 1999 2000 2001 2002 2003 2004 2005 2006 2007 2008 2009 2010 2011 2012 2013 2014 VALUE LINE PUB. LLC 16-18 54.11 54.15 57.88 63.81 61.88 4501 52.03 46.73 50.96 41.41 42.13 11.07 11.95 13.48 12.37 13.00 14.20 15.35 Sales per sh 17.45 6.41 6.48 6.60 5.54 3.67 226 5.46 3.58 4.17 3.85 441 2.49 2.92 1.91 1.75 1.71 2.50 2.85 Cash Flow per sh 3.45 1.24 128 141 d. 17 0232 01.79 188 52 1.13 1.50 2.36 1.73 2.04 1.12 102 1.08 1.85 2.15 Faminas per shA 250 1.71 174 1.74 1.74 1.17 .60 .60 60 2.12 1.98 2.04 2.04 2.04 1.84 1.24 1.24 1.30 Divds Deeld per sh 1.52 5.15 474 8120 5.55 132 1.81 2.75 169 3780 1.15 82 66 29 29 58 .40 50 Cap Spending per sh 32.82 32.19 750 31.79 28.69 24.98 15.07 18.28 2322 24.01 14.68 1473 4.99 5.77 5.11 3.54 3.43 3.85 4.20 Book Value per sh 5.95 2899 20.92 2897 2035 2031 28581 28981 292 29:37 38.62392839.74 363 40103 4020 40.39 40150 40.70 Common Shs Outsig 41.30 9876 3113 2012 -- 143 NMF 44.1 252 27 132 309 341 320 Bold are Avg Ann' PIE Ratio 267 2.11 1.64 1.61 NMF 2.35 1.36 1.01 1.43 .68 1.97 2.14 2.05 Vaune Relative PIE Ratio 1.75 3.8% 4.3% 4.49 48% 3.75 20% 23% 14% 12% 5.3% 4.4% 50% 7.6% 59% 5.3% 3.7% Avg Ann'l Div'd Yield 2.3% CAPITAL STRUCTURE as of 6/30/13 1506.61351.5 1496.1 16078 1654.0 4400 4762 539.4 497.4 525.1 S75 625 Sales (Smill 720 Total Debt $320.1 mil. Due in 5 Yrs $67.9 mill 14.6% 13.5% 10,9% 10.5% 120% 20.8% 25.5% 200% LT Debt $320.1 mill 20.9% 212%24.0% 20% Operating Margin LT interest $23.0 mill 24.0% 1049 883 89.4 910 80.1 302 347 312 29.1 262 26.0 28.0 Depreciation (Smill) 35.0 (Total int coverage: 3.3x, LT int eamed: 3.3x) 532 15.3 330 586 932 688 81.7 452 41.1 43.0 75.0 90.0 (Net Profit (Smit 110 (72% of Capt) 33.9%94% 30.6% 7.75 9.9% 27.7% 12.0% 8.0% income Tax Rate 8.0% Leases Uncapitalized Annual Rentals $3.3 mill. 3.5% 1.15 2.2% 3.6% 5.6% 15.6% 17.2% 8.4% Pension Assets-12/12 5345.6 mil. 8.3% 8.2% 13.1% 14.1% Net Profit Margin 15.1% 160.8 2551 2556 1602 49.3 1914 632 958 573 745 110 150 Working Cap'l (Small) 305 Oblig. $445.5 mill. 618.3 335.4333.1 321.5 3213 2209 388.4 3635 3447 3492 320 310 Long-Term Debt (Smil 300 Preferred Stock None 470.9 67147051 5779578.3 1982 229.8 2044 1421 138.6 155 170 Shr. Equity Smill) 245 Common Stock 40.529.285 shares 7.1% 3.7% 4.5% 7.9% 11,9% 18.9% 15.5% 10.4% 11.39 11.44 18.0% 20.5% Return on Total Cap 21.5% 11.3% 2.3% 47% 10.1% 16.1% 347% 35,6% 22.18 MARKET CAP: $1.6 billion (Mid Cap) 28.9% 310% 48.5% 52.0% Return on Shr. Equity 44.5% 7.6% NVF 22% NMF 2.7% NUF 3% NUF NMF NMF 16.5% 20.5% Retained to Com Eq 18.5% CURRENT POSITION 2011 2012 6/30/13 32% 115% SMLL) 53% NMF 83% 117% 99% NMF NMF 116% 67% 60% Al Divds to Net Prof 58% no BUCJMECC. Dina Alts Remis Plan Parsin Estimated Price 38.48 Expected return 8.52% SE L 10 anh on. end


