Find the following:
quick ratio, operating profit margin, and net profit margin.
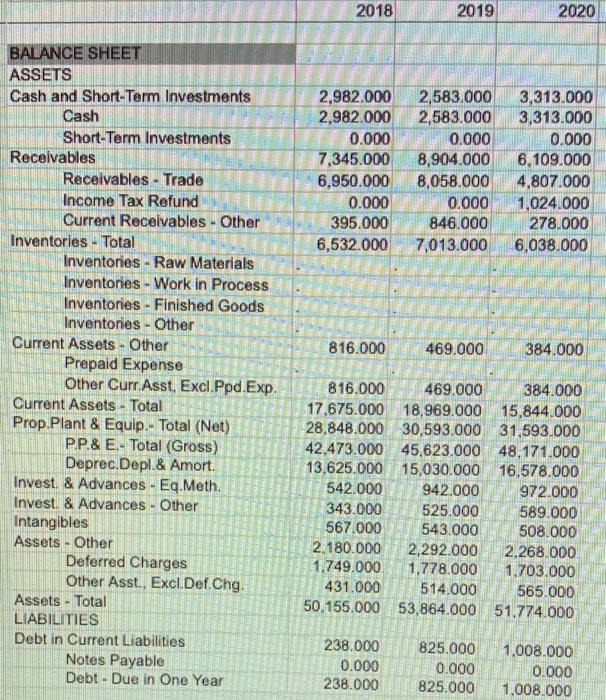
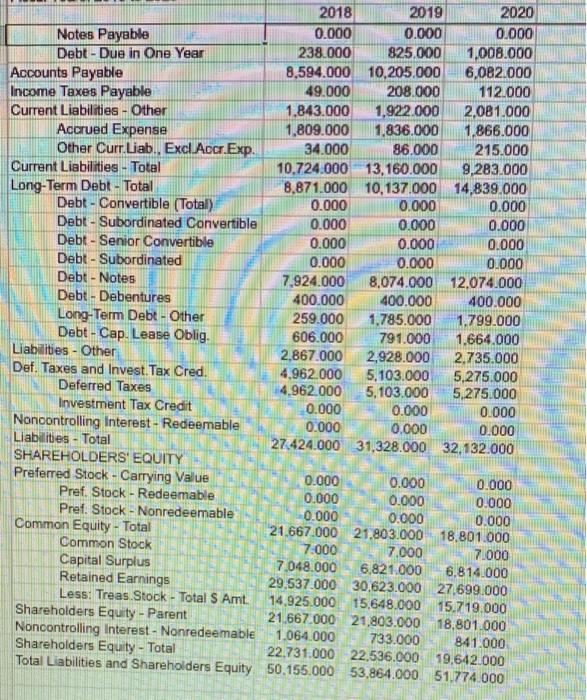
2018 2019 2020 2,982.000 2,982.000 0.000 7,345.000 6,950.000 0.000 395.000 6,532.000 2,583.000 2,583.000 0.000 8,904.000 8,058.000 0.000 846.000 7,013.000 3,313.000 3,313.000 0.000 6,109.000 4,807.000 1,024.000 278.000 6,038.000 816.000 469.000 384.000 BALANCE SHEET ASSETS Cash and Short-Term Investments Cash Short-Term Investments Receivables Receivables - Trade Income Tax Refund Current Receivables. Other Inventories - Total Inventories - Raw Materials Inventories - Work in Process Inventories - Finished Goods Inventories - Other Current Assets - Other Prepaid Expense Other Curr Asst, Excl.Ppd.Exp. Current Assets - Total Prop.Plant & Equip - Total (Net) P.P.& E.. Total (Gross) Deprec.Depl.& Amort. Invest. & Advances - Eq.Meth. Invest. & Advances - Other Intangibles Assets - Other Deferred Charges Other Asst., Excl.Def. Chg. Assets - Total LIABILITIES Debt in Current Liabilities Notes Payable Debt - Due in One Year 816.000 469.000 384.000 17.675.000 18,969.000 15,844.000 28,848.000 30,593.000 31,593.000 42.473.000 45,623.000 48,171.000 13,625.000 15,030.000 16.578.000 542.000 942.000 972.000 343.000 525.000 589.000 567.000 543.000 508.000 2.180.000 2,292.000 2,268.000 1.749.000 1,778.000 1.703.000 431.000 514.000 565.000 50.155.000 53,864.000 51.774.000 238.000 0.000 238.000 825.000 0.000 825.000 1.008.000 0.000 1.008.000 2018 2019 2020 Notes Payable 0.000 0.000 0.000 Debt-Due in One Year 238.000 825.000 1.008.000 Accounts Payable 8,594.000 10,205.000 6,082.000 Income Taxes Payable 49.000 208.000 112.000 Current Liabilities - Other 1,843.000 1,922.000 2.081.000 Accrued Expense 1,809.000 1,836.000 1,866.000 Other Curr.Liab.. Excl Accr.Exp. 34.000 86.000 215.000 Current Liabilities - Total 10.724.000 13,160.000 9,283.000 Long-Term Debt - Total 8,871.000 10,137.000 14,839.000 Debt - Convertible (Total) 0.000 0.000 0.000 Debt - Subordinated Convertible 0.000 0.000 0.000 Debt - Senior Convertible 0.000 0.000 0.000 Debt - Subordinated 0.000 0.000 0.000 Debt - Notes 7,924.000 8,074.000 12.074.000 Debt-Debentures 400.000 400.000 400.000 Long-Term Debt - Other 259.000 1.785.000 1.799.000 Debt - Cap. Lease Oblig. 606.000 791.000 1.664.000 Liabilities - Other 2,867.000 2,928.000 2.735.000 Def. Taxes and Invest.Tax Cred. 4.962.000 5,103.000 5,275.000 Deferred Taxes 4,962.000 5,103.000 5.275.000 Investment Tax Credit 0.000 0.000 0.000 Noncontrolling Interest - Redeemable 0.000 0.000 0.000 Liabilities - Total 27.424.000 31,328.000 32.132.000 SHAREHOLDERS' EQUITY Preferred Stock - Carrying Value 0.000 0.000 0.000 Pref. Stock - Redeemable 0.000 0.000 0.000 Pref. Stock - Nonredeemable 0.000 0.000 0.000 Common Equity - Total 21.667.000 21.803.000 18,801.000 Common Stock 7.000 7,000 7.000 Capital Surplus 7.048.000 6,821.000 6,814.000 Retained Earnings 29,537.000 30.623.000 27.699.000 Less: Treas. Stock - Total $ Amt. 14.925.000 15.648.000 15.719.000 Shareholders Equity - Parent 21.667.000 21,803.000 - 18,801.000 Noncontrolling Interest - Nonredeemable 1.064.000 733.000 841.000 Shareholders Equity - Total 22.731.000 22.536.000 19.642.000 Total Liabilities and Shareholders Equity 50.155.000 53,864.000 51.774.000


