Find the following ratios for each company for the last three years:
| Ratio | Firm A | Firm B |
| 2019 | 2020 | 2021 | 2019 | 2020 | 2021 |
| Current ratio | | | | | | |
| Debt-equity | | | | | | |
| Times int earned | | | | | | |
| Invtry turnover | | | | | | |
| TA turnover | | | | | | |
| Profit margin | | | | | | |
| Return on assets | | | | | | |
Data belowL
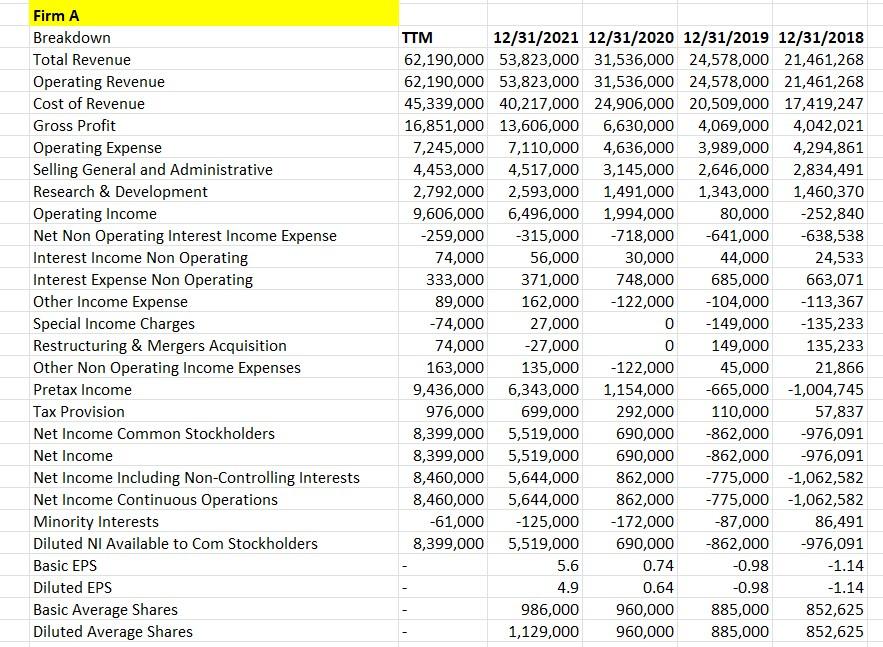
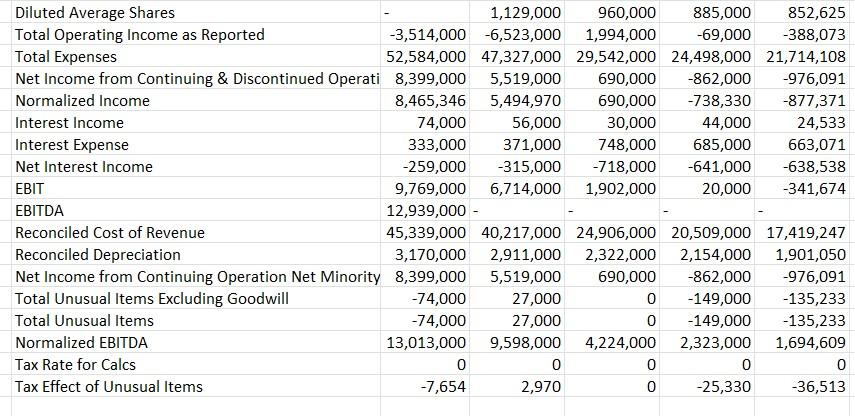
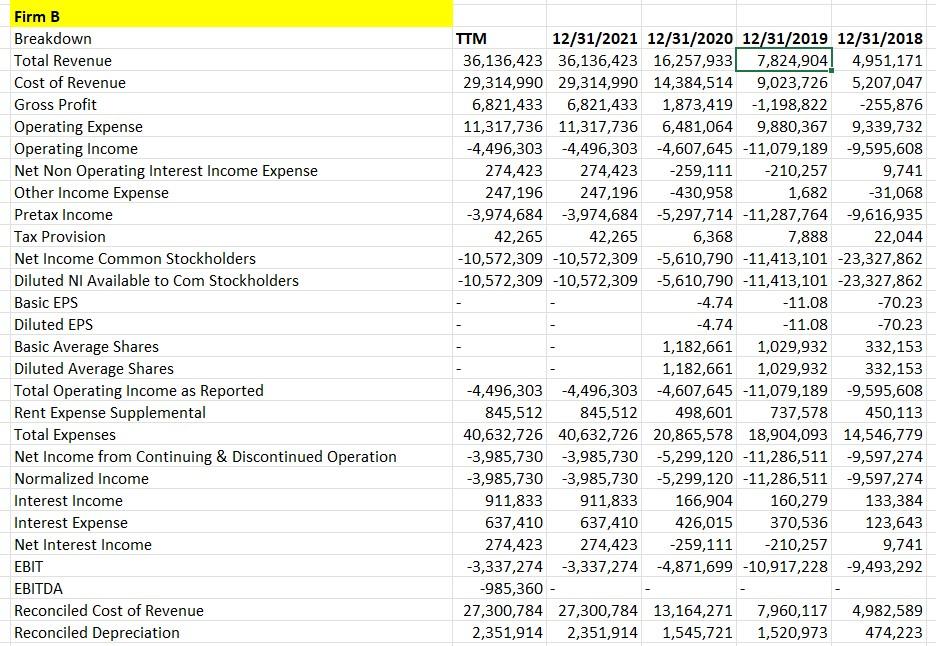

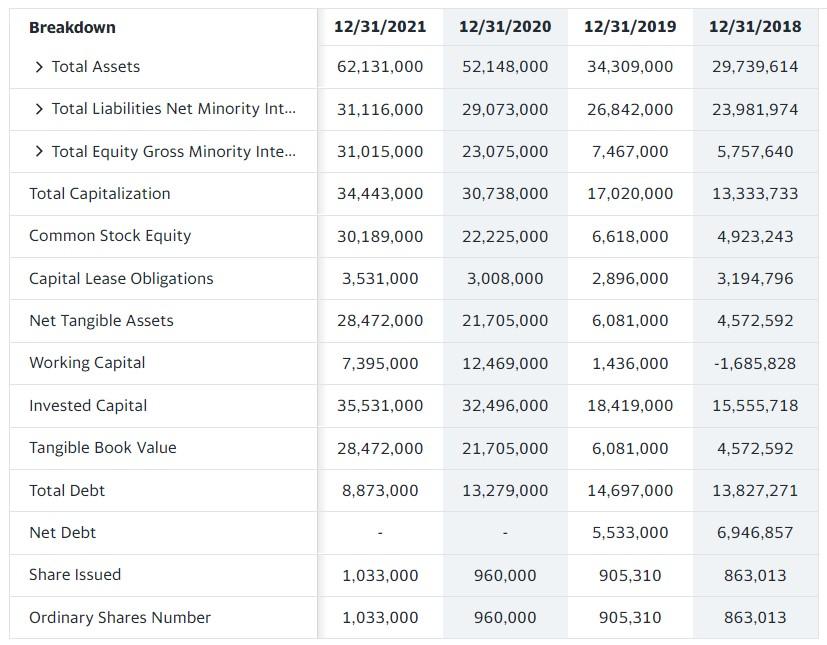
Balance Sheet Information:
FIRM A
FIRM B
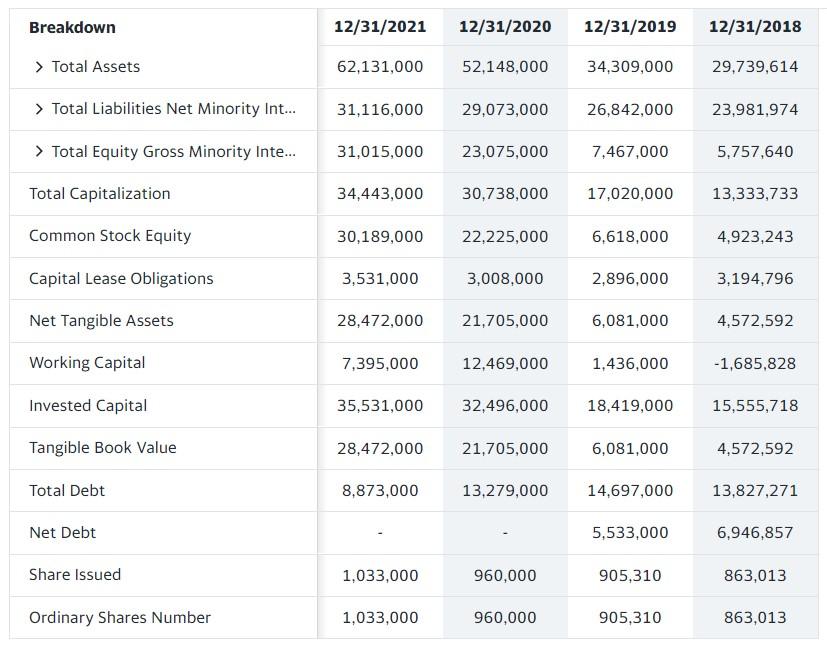
Firm A Breakdown Total Revenue Operating Revenue Cost of Revenue Gross Profit Operating Expense Selling General and Administrative Research & Development Operating Income Net Non Operating Interest Income Expense Interest Income Non Operating Interest Expense Non Operating Other Income Expense Special Income Charges Restructuring & Mergers Acquisition Other Non Operating Income Expenses Pretax Income Tax Provision Net Income Common Stockholders Net Income Net Income Including Non-Controlling Interests Net Income Continuous Operations Minority Interests Diluted NI Available to Com Stockholders Basic EPS Diluted EPS Basic Average Shares Diluted Average Shares TTM 12/31/2021 12/31/2020 12/31/2019 12/31/2018 62,190,000 53,823,000 31,536,000 24,578,000 21,461,268 62,190,000 53,823,000 31,536,000 24,578,000 21,461,268 45,339,000 40,217,000 24,906,000 20,509,000 17,419,247 16,851,000 13,606,000 6,630,000 4,069,000 4,042,021 7,245,000 7,110,000 4,636,000 3,989,000 4,294,861 4,453,000 4,517,000 3,145,000 2,646,000 2,834,491 2,792,000 2,593,000 1,491,000 1,343,000 1,460,370 9,606,000 6,496,000 1,994,000 80,000 -252,840 -259,000 -315,000 -718,000 -641,000 -638,538 74,000 56,000 30,000 44,000 24,533 333,000 371,000 748,000 685,000 663,071 89,000 162,000 -122,000 -104,000 -113,367 -74,000 27,000 0 -149,000 -135,233 74,000 -27,000 0 149,000 135,233 163,000 135,000 -122,000 45,000 21,866 9,436,000 6,343,000 1,154,000 -665,000 -1,004,745 57,837 -976,091 976,000 699,000 292,000 110,000 8,399,000 5,519,000 690,000 -862,000 8,399,000 5,519,000 8,460,000 5,644,000 8,460,000 5,644,000 -61,000 -125,000 690,000 -862,000 -976,091 862,000 -775,000 -1,062,582 862,000 -775,000 -1,062,582 -172,000 -87,000 86,491 690,000 -862,000 8,399,000 5,519,000 -976,091 5.6 0.74 -0.98 -1.14 4.9 0.64 -0.98 -1.14 986,000 960,000 885,000 852,625 1,129,000 960,000 885,000 852,625 1 Diluted Average Shares 1,129,000 960,000 885,000 852,625 Total Operating Income as Reported -3,514,000 -6,523,000 1,994,000 Total Expenses -69,000 -388,073 52,584,000 47,327,000 29,542,000 24,498,000 21,714,108 Net Income from Continuing & Discontinued Operati 8,399,000 5,519,000 690,000 -862,000 -976,091 Normalized Income 8,465,346 5,494,970 690,000 -738,330 -877,371 Interest Income 30,000 24,533 74,000 56,000 333,000 371,000 44,000 748,000 685,000 Interest Expense 663,071 Net Interest Income -259,000 -315,000 -718,000 -641,000 -638,538 EBIT 20,000 -341,674 9,769,000 6,714,000 1,902,000 12,939,000 - EBITDA Reconciled Cost of Revenue Reconciled Depreciation 45,339,000 40,217,000 24,906,000 20,509,000 17,419,247 3,170,000 2,911,000 2,322,000 2,154,000 1,901,050 690,000 -862,000 -976,091 Net Income from Continuing Operation Net Minority 8,399,000 5,519,000 Total Unusual Items Excluding Goodwill -74,000 27,000 0 -149,000 -135,233 Total Unusual Items -74,000 27,000 0 -149,000 -135,233 Normalized EBITDA 13,013,000 9,598,000 4,224,000 2,323,000 1,694,609 Tax Rate for Calcs 0 0 0 0 0 Tax Effect of Unusual Items -7,654 2,970 0 -25,330 -36,513 Firm B Breakdown Total Revenue Cost of Revenue Gross Profit Operating Expense Operating Income Net Non Operating Interest Income Expense Other Income Expense Pretax Income Tax Provision Net Income Common Stockholders Diluted NI Available to Com Stockholders Basic EPS Diluted EPS Basic Average Shares Diluted Average Shares Total Operating Income as Reported Rent Expense Supplemental Total Expenses Net Income from Continuing & Discontinued Operation Normalized Income Interest Income Interest Expense Net Interest Income EBIT EBITDA Reconciled Cost of Revenue Reconciled Depreciation TTM 12/31/2021 12/31/2020 12/31/2019 12/31/2018 36,136,423 36,136,423 16,257,933 7,824,904 4,951,171 29,314,990 29,314,990 14,384,514 9,023,726 5,207,047 6,821,433 6,821,433 1,873,419 -1,198,822 -255,876 11,317,736 11,317,736 6,481,064 9,880,367 9,339,732 -4,496,303 -4,496,303 -4,607,645 -11,079,189 -9,595,608 274,423 274,423 -259,111 -210,257 247,196 247,196 -430,958 1,682 -31,068 -3,974,684 -3,974,684 -5,297,714 -11,287,764 -9,616,935 42,265 42,265 6,368 7,888 22,044 -10,572,309 -10,572,309 -5,610,790 -11,413,101 -23,327,862 -5,610,790 -11,413,101 -23,327,862 9,741 -10,572,309 -10,572,309 -4.74 -11.08 -70.23 -4.74 -11.08 -70.23 1,182,661 1,029,932 332,153 1,182,661 1,029,932 332,153 845,512 -4,496,303 -4,496,303 -4,607,645 -11,079,189 -9,595,608 845,512 498,601 737,578 450,113 40,632,726 40,632,726 20,865,578 18,904,093 14,546,779 -3,985,730 -3,985,730 -5,299,120 -11,286,511 -9,597,274 -3,985,730 -3,985,730 -5,299,120 -11,286,511 -9,597,274 911,833 160,279 133,384 166,904 426,015 370,536 637,410 123,643 911,833 637,410 274,423 274,423 -259,111 -210,257 -3,337,274 -3,337,274 -4,871,699 -10,917,228 -9,493,292 9,741 -985,360 - 27,300,784 27,300,784 13,164,271 7,960,117 4,982,589 2,351,914 2,351,914 1,545,721 1,520,973 474,223 Net Income from Continuing Operation Net Minority Interest Normalized EBITDA Tax Rate for Calcs Tax Effect of Unusual Items -3,985,730 -3,985,730 -5,299,120 -11,286,511 -9,597,274 -985,360 -985,360 -3,325,978 -9,396,255 -9,019,069 0 0 0 0 0 0 0 0 0 0 Breakdown 12/31/2021 12/31/2020 12/31/2019 12/31/2018 > Total Assets 62,131,000 52,148,000 34,309,000 29,739,614 > Total Liabilities Net Minority Int... 31,116,000 29,073,000 26,842,000 23,981,974 > Total Equity Gross Minority Inte... 31,015,000 23,075,000 7,467,000 5,757,640 Total Capitalization 34,443,000 30,738,000 17,020,000 13,333,733 Common Stock Equity 30,189,000 22,225,000 6,618,000 4,923,243 Capital Lease Obligations 3,531,000 3,008,000 2,896,000 3,194,796 Net Tangible Assets 28,472,000 21,705,000 6,081,000 4,572,592 Working Capital 7,395,000 12,469,000 1,436,000 -1,685,828 Invested Capital 35,531,000 32,496,000 18,419,000 15,555,718 Tangible Book Value 28,472,000 21,705,000 6,081,000 4,572,592 Total Debt 8,873,000 13,279,000 14,697,000 13,827,271 Net Debt 5,533,000 6,946,857 Share Issued 1,033,000 960,000 905,310 863,013 Ordinary Shares Number 1,033,000 960,000 905,310 863,013 Breakdown 12/31/2021 12/31/2020 12/31/2019 12/31/2018 > Total Assets 62,131,000 52,148,000 34,309,000 29,739,614 > Total Liabilities Net Minority Int... 31,116,000 29,073,000 26,842,000 23,981,974 > Total Equity Gross Minority Inte... 31,015,000 23,075,000 7,467,000 5,757,640 Total Capitalization 34,443,000 30,738,000 17,020,000 13,333,733 Common Stock Equity 30,189,000 22,225,000 6,618,000 4,923,243 Capital Lease Obligations 3,531,000 3,008,000 2,896,000 3,194,796 Net Tangible Assets 28,472,000 21,705,000 6,081,000 4,572,592 Working Capital 7,395,000 12,469,000 1,436,000 -1,685,828 Invested Capital 35,531,000 32,496,000 18,419,000 15,555,718 Tangible Book Value 28,472,000 21,705,000 6,081,000 4,572,592 Total Debt 8,873,000 13,279,000 14,697,000 13,827,271 Net Debt 5,533,000 6,946,857 Share Issued 1,033,000 960,000 905,310 863,013 Ordinary Shares Number 1,033,000 960,000 905,310 863,013 Firm A Breakdown Total Revenue Operating Revenue Cost of Revenue Gross Profit Operating Expense Selling General and Administrative Research & Development Operating Income Net Non Operating Interest Income Expense Interest Income Non Operating Interest Expense Non Operating Other Income Expense Special Income Charges Restructuring & Mergers Acquisition Other Non Operating Income Expenses Pretax Income Tax Provision Net Income Common Stockholders Net Income Net Income Including Non-Controlling Interests Net Income Continuous Operations Minority Interests Diluted NI Available to Com Stockholders Basic EPS Diluted EPS Basic Average Shares Diluted Average Shares TTM 12/31/2021 12/31/2020 12/31/2019 12/31/2018 62,190,000 53,823,000 31,536,000 24,578,000 21,461,268 62,190,000 53,823,000 31,536,000 24,578,000 21,461,268 45,339,000 40,217,000 24,906,000 20,509,000 17,419,247 16,851,000 13,606,000 6,630,000 4,069,000 4,042,021 7,245,000 7,110,000 4,636,000 3,989,000 4,294,861 4,453,000 4,517,000 3,145,000 2,646,000 2,834,491 2,792,000 2,593,000 1,491,000 1,343,000 1,460,370 9,606,000 6,496,000 1,994,000 80,000 -252,840 -259,000 -315,000 -718,000 -641,000 -638,538 74,000 56,000 30,000 44,000 24,533 333,000 371,000 748,000 685,000 663,071 89,000 162,000 -122,000 -104,000 -113,367 -74,000 27,000 0 -149,000 -135,233 74,000 -27,000 0 149,000 135,233 163,000 135,000 -122,000 45,000 21,866 9,436,000 6,343,000 1,154,000 -665,000 -1,004,745 57,837 -976,091 976,000 699,000 292,000 110,000 8,399,000 5,519,000 690,000 -862,000 8,399,000 5,519,000 8,460,000 5,644,000 8,460,000 5,644,000 -61,000 -125,000 690,000 -862,000 -976,091 862,000 -775,000 -1,062,582 862,000 -775,000 -1,062,582 -172,000 -87,000 86,491 690,000 -862,000 8,399,000 5,519,000 -976,091 5.6 0.74 -0.98 -1.14 4.9 0.64 -0.98 -1.14 986,000 960,000 885,000 852,625 1,129,000 960,000 885,000 852,625 1 Diluted Average Shares 1,129,000 960,000 885,000 852,625 Total Operating Income as Reported -3,514,000 -6,523,000 1,994,000 Total Expenses -69,000 -388,073 52,584,000 47,327,000 29,542,000 24,498,000 21,714,108 Net Income from Continuing & Discontinued Operati 8,399,000 5,519,000 690,000 -862,000 -976,091 Normalized Income 8,465,346 5,494,970 690,000 -738,330 -877,371 Interest Income 30,000 24,533 74,000 56,000 333,000 371,000 44,000 748,000 685,000 Interest Expense 663,071 Net Interest Income -259,000 -315,000 -718,000 -641,000 -638,538 EBIT 20,000 -341,674 9,769,000 6,714,000 1,902,000 12,939,000 - EBITDA Reconciled Cost of Revenue Reconciled Depreciation 45,339,000 40,217,000 24,906,000 20,509,000 17,419,247 3,170,000 2,911,000 2,322,000 2,154,000 1,901,050 690,000 -862,000 -976,091 Net Income from Continuing Operation Net Minority 8,399,000 5,519,000 Total Unusual Items Excluding Goodwill -74,000 27,000 0 -149,000 -135,233 Total Unusual Items -74,000 27,000 0 -149,000 -135,233 Normalized EBITDA 13,013,000 9,598,000 4,224,000 2,323,000 1,694,609 Tax Rate for Calcs 0 0 0 0 0 Tax Effect of Unusual Items -7,654 2,970 0 -25,330 -36,513 Firm B Breakdown Total Revenue Cost of Revenue Gross Profit Operating Expense Operating Income Net Non Operating Interest Income Expense Other Income Expense Pretax Income Tax Provision Net Income Common Stockholders Diluted NI Available to Com Stockholders Basic EPS Diluted EPS Basic Average Shares Diluted Average Shares Total Operating Income as Reported Rent Expense Supplemental Total Expenses Net Income from Continuing & Discontinued Operation Normalized Income Interest Income Interest Expense Net Interest Income EBIT EBITDA Reconciled Cost of Revenue Reconciled Depreciation TTM 12/31/2021 12/31/2020 12/31/2019 12/31/2018 36,136,423 36,136,423 16,257,933 7,824,904 4,951,171 29,314,990 29,314,990 14,384,514 9,023,726 5,207,047 6,821,433 6,821,433 1,873,419 -1,198,822 -255,876 11,317,736 11,317,736 6,481,064 9,880,367 9,339,732 -4,496,303 -4,496,303 -4,607,645 -11,079,189 -9,595,608 274,423 274,423 -259,111 -210,257 247,196 247,196 -430,958 1,682 -31,068 -3,974,684 -3,974,684 -5,297,714 -11,287,764 -9,616,935 42,265 42,265 6,368 7,888 22,044 -10,572,309 -10,572,309 -5,610,790 -11,413,101 -23,327,862 -5,610,790 -11,413,101 -23,327,862 9,741 -10,572,309 -10,572,309 -4.74 -11.08 -70.23 -4.74 -11.08 -70.23 1,182,661 1,029,932 332,153 1,182,661 1,029,932 332,153 845,512 -4,496,303 -4,496,303 -4,607,645 -11,079,189 -9,595,608 845,512 498,601 737,578 450,113 40,632,726 40,632,726 20,865,578 18,904,093 14,546,779 -3,985,730 -3,985,730 -5,299,120 -11,286,511 -9,597,274 -3,985,730 -3,985,730 -5,299,120 -11,286,511 -9,597,274 911,833 160,279 133,384 166,904 426,015 370,536 637,410 123,643 911,833 637,410 274,423 274,423 -259,111 -210,257 -3,337,274 -3,337,274 -4,871,699 -10,917,228 -9,493,292 9,741 -985,360 - 27,300,784 27,300,784 13,164,271 7,960,117 4,982,589 2,351,914 2,351,914 1,545,721 1,520,973 474,223 Net Income from Continuing Operation Net Minority Interest Normalized EBITDA Tax Rate for Calcs Tax Effect of Unusual Items -3,985,730 -3,985,730 -5,299,120 -11,286,511 -9,597,274 -985,360 -985,360 -3,325,978 -9,396,255 -9,019,069 0 0 0 0 0 0 0 0 0 0 Breakdown 12/31/2021 12/31/2020 12/31/2019 12/31/2018 > Total Assets 62,131,000 52,148,000 34,309,000 29,739,614 > Total Liabilities Net Minority Int... 31,116,000 29,073,000 26,842,000 23,981,974 > Total Equity Gross Minority Inte... 31,015,000 23,075,000 7,467,000 5,757,640 Total Capitalization 34,443,000 30,738,000 17,020,000 13,333,733 Common Stock Equity 30,189,000 22,225,000 6,618,000 4,923,243 Capital Lease Obligations 3,531,000 3,008,000 2,896,000 3,194,796 Net Tangible Assets 28,472,000 21,705,000 6,081,000 4,572,592 Working Capital 7,395,000 12,469,000 1,436,000 -1,685,828 Invested Capital 35,531,000 32,496,000 18,419,000 15,555,718 Tangible Book Value 28,472,000 21,705,000 6,081,000 4,572,592 Total Debt 8,873,000 13,279,000 14,697,000 13,827,271 Net Debt 5,533,000 6,946,857 Share Issued 1,033,000 960,000 905,310 863,013 Ordinary Shares Number 1,033,000 960,000 905,310 863,013 Breakdown 12/31/2021 12/31/2020 12/31/2019 12/31/2018 > Total Assets 62,131,000 52,148,000 34,309,000 29,739,614 > Total Liabilities Net Minority Int... 31,116,000 29,073,000 26,842,000 23,981,974 > Total Equity Gross Minority Inte... 31,015,000 23,075,000 7,467,000 5,757,640 Total Capitalization 34,443,000 30,738,000 17,020,000 13,333,733 Common Stock Equity 30,189,000 22,225,000 6,618,000 4,923,243 Capital Lease Obligations 3,531,000 3,008,000 2,896,000 3,194,796 Net Tangible Assets 28,472,000 21,705,000 6,081,000 4,572,592 Working Capital 7,395,000 12,469,000 1,436,000 -1,685,828 Invested Capital 35,531,000 32,496,000 18,419,000 15,555,718 Tangible Book Value 28,472,000 21,705,000 6,081,000 4,572,592 Total Debt 8,873,000 13,279,000 14,697,000 13,827,271 Net Debt 5,533,000 6,946,857 Share Issued 1,033,000 960,000 905,310 863,013 Ordinary Shares Number 1,033,000 960,000 905,310 863,013


