Answered step by step
Verified Expert Solution
Link Copied!

Question

1 Approved Answer

Find the indicated IQ score. The graph to the right depicts IQ scores of? adults, and those scores are normally distributed with a mean of

Find the indicated IQ score. The graph to the right depicts IQ scores of? adults, and those scores are normally distributed with a mean of 100 and a standard deviation of 15.

image text in transcribedimage text in transcribed
Standard Normal Table (Page 1) Standard Normal (z) Distribution: Cumulative Area from the LEFT 00 .01 02 .03 .04 .05 .06 .07 108 .09 0.7 -3,50 and X lower .0001 -3.4 0003 0003 0003 0003 0003 0003 0003 0003 0003 0002 -3.3 0005 0005 0005 0004 .0004 0004 0004 0004 0004 0003 -3.2 0007 0007 0006 0006 0006 0006 0006 0005 DO05 0005 -3,1 0010 0009 0009 0009 0008 DO08 0008 0008 0007 0007 -3.0 0013 0013 0013 0012 0012 0011 .0011 0010 0010 -2.9 .0019 0018 0018 0017 0016 0016 0015 0015 0014 0014 -2.8 .0026 0025 0024 0023 0023 .0022 5021 .0021 0020 .0019 -2.7 .0035 .0034 0033 0032 .0031 .0030 0029 .0028 0027 0026 -2.6 0047 0045 0044 0043 .0041 0040 0039 .0038 0037 0036 -2.5 .0062 0060 0059 0057 .0055 0054 0052 .0051 0049 0048 -2.4 .0082 .0080 0078 0075 0072 0071 0069 .0068 0066 0064 -2.3 .0107 0104 0102 0099 0096 0094 0091 .0089 0087 .0084 -2.2 .0139 0136 0132 0129 0125 0122 0119 .0116 0113 -2.1 0179 0174 0170 0166 0162 0158 0154 0150 0146 0143 -2.0 0228 0222 0217 .0212 0207 0202 0197 0192 018 8 0183 -1.9 0287 0281 0274 0268 0262 0256 0250 0244 .0239 .0233 -1.8 0359 0351 0344 0336 0329 0327 0314 0307 301 0294 -1.7 0446 0436 0427 0418 0409 0401 .0392 0384 0375 0367 -1.6 .0548 0537 0526 0516 0505 .0495 0485 0475 0465 0455 -1.5 .0668 0655 0643 0630 0618 .0606 .0594 .0582 0571 0559 -1.4 0808 0793 0778 0764 0749 0735 0721 0708 0694 0681 -1.3 0968 0951 0934 0918 0901 0885 0869 .0853 0838 0823 -1.2 .1151 .1131 .1112 1093 1075 056 1038 .1020 1003 0985 -1.1 .1357 1335 314 1292 1271 1251 1230 .1210 190 1170 -1.0 .1587 1562 539 1515 1492 1469 1446 .1423 1401 .1379 -0.9 1841 1814 178 1762 1736 1711 1685 1660 635 1611 -0.8 2119 2090 206 2033 2005 1977 1949 1927 1894 1867 -0.7 2420 2385 2358 2327 2296 2266 2236 2206 2177 2148 2451 -0.6 2743 2709 2676 2643 .2611 2578 2546 2514 2483 -0.5 .3085 3050 3015 2981 2946 .2912 2877 .2843 2810 2776 -0.4 3446 3409 3372 3336 3300 3264 3228 3192 3156 3121 -0,3 .3821 3783 3745 3707 3669 3632 3594 3557 3520 .3483 -0.2 4207 4168 4129 4090 4052 4013 3974 3936 3897 3859 -0.1 .4602 4562 4522 4483 4443 .4404 4364 .4325 4286 .4247\f

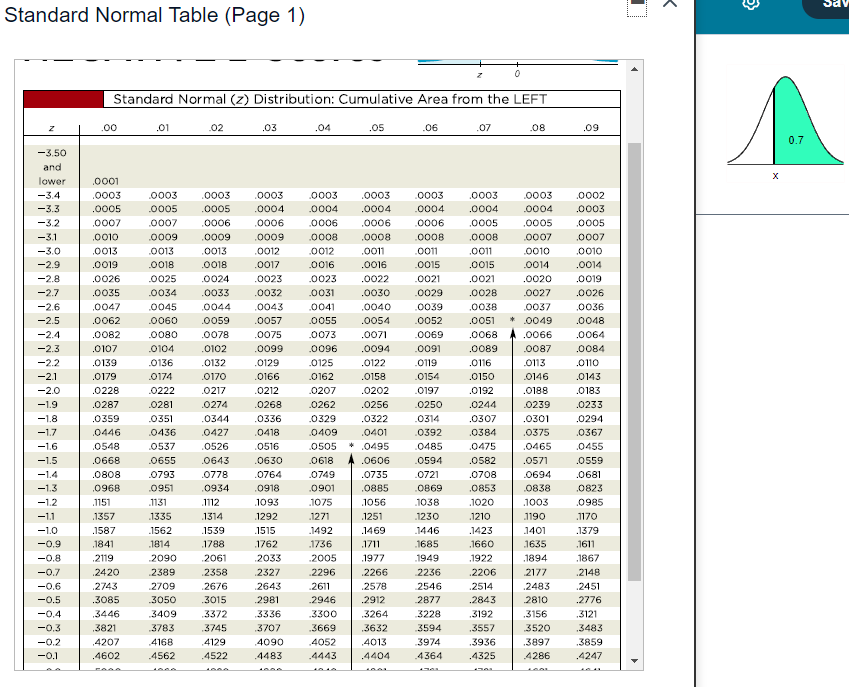
Step by Step Solution

There are 3 Steps involved in it

Step: 1

blur-text-image

Get Instant Access to Expert-Tailored Solutions

See step-by-step solutions with expert insights and AI powered tools for academic success

Step: 2

blur-text-image

Step: 3

blur-text-image

Ace Your Homework with AI

Get the answers you need in no time with our AI-driven, step-by-step assistance

Get Started

Recommended Textbook for

Intermediate Algebra

Authors: Marvin L Bittinger

11th Edition

ISBN: 0321968395, 9780321968395

More Books

Students also viewed these Mathematics questions

Question

What is a native XML database?

Answered: 1 week ago

Question

5. Describe how contexts affect listening

Answered: 1 week ago