

Answered step by step
Verified Expert Solution
Question
1 Approved Answer
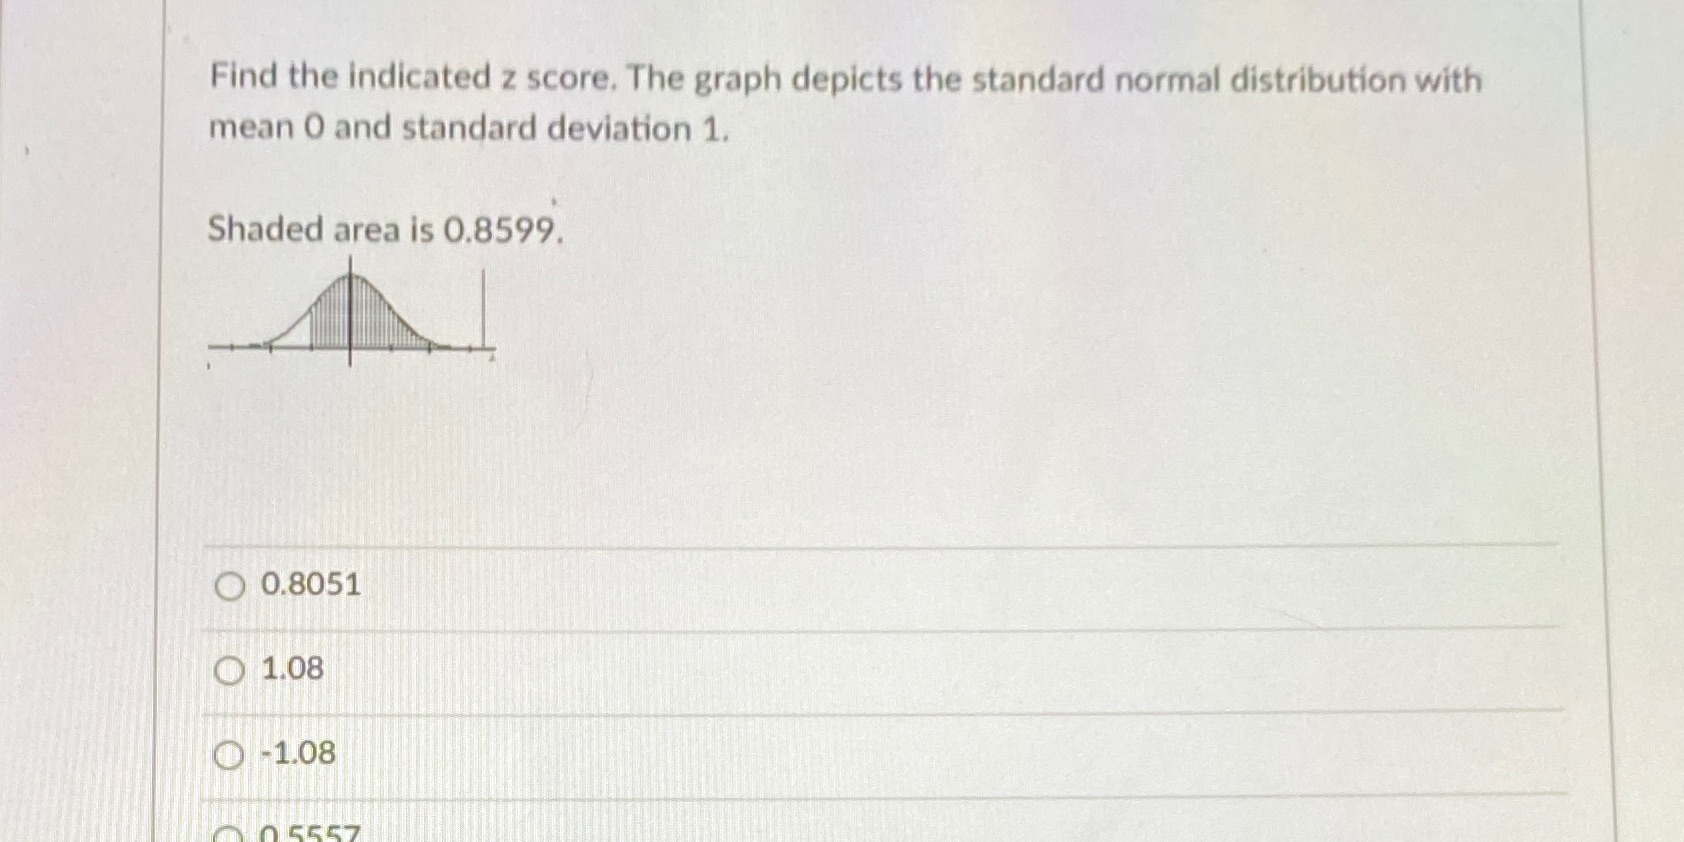
Find the indicated z score. The graph depicts the standard normal distribution with mean O and standard deviation 1. Shaded area is 0.8599. 0.8051 1.08
Step by Step Solution
There are 3 Steps involved in it
Step: 1

Get Instant Access to Expert-Tailored Solutions
See step-by-step solutions with expert insights and AI powered tools for academic success
Step: 2

Step: 3
Ace Your Homework with AI
Get the answers you need in no time with our AI-driven, step-by-step assistance
Get Started
Advanced Calculus
Authors: R Creighton Buck
3rd Edition
147861613X, 9781478616139